Mark Kimsey, Director of the Intermountain Forestry Cooperative, discusses the modeling and mapping of forest carrying capacity, beginning with the historical context
Effective density management is crucial for maintaining the health and productivity of forested landscapes. This requires understanding the relationship between tree species, environmental factors, and the biological limit of forest carrying capacity. Nearly a century ago, Reineke (1933) argued that site resource abundance (e.g., water, nutrients, temperature) did not directly determine a forest’s capacity to support a maximum number of trees.
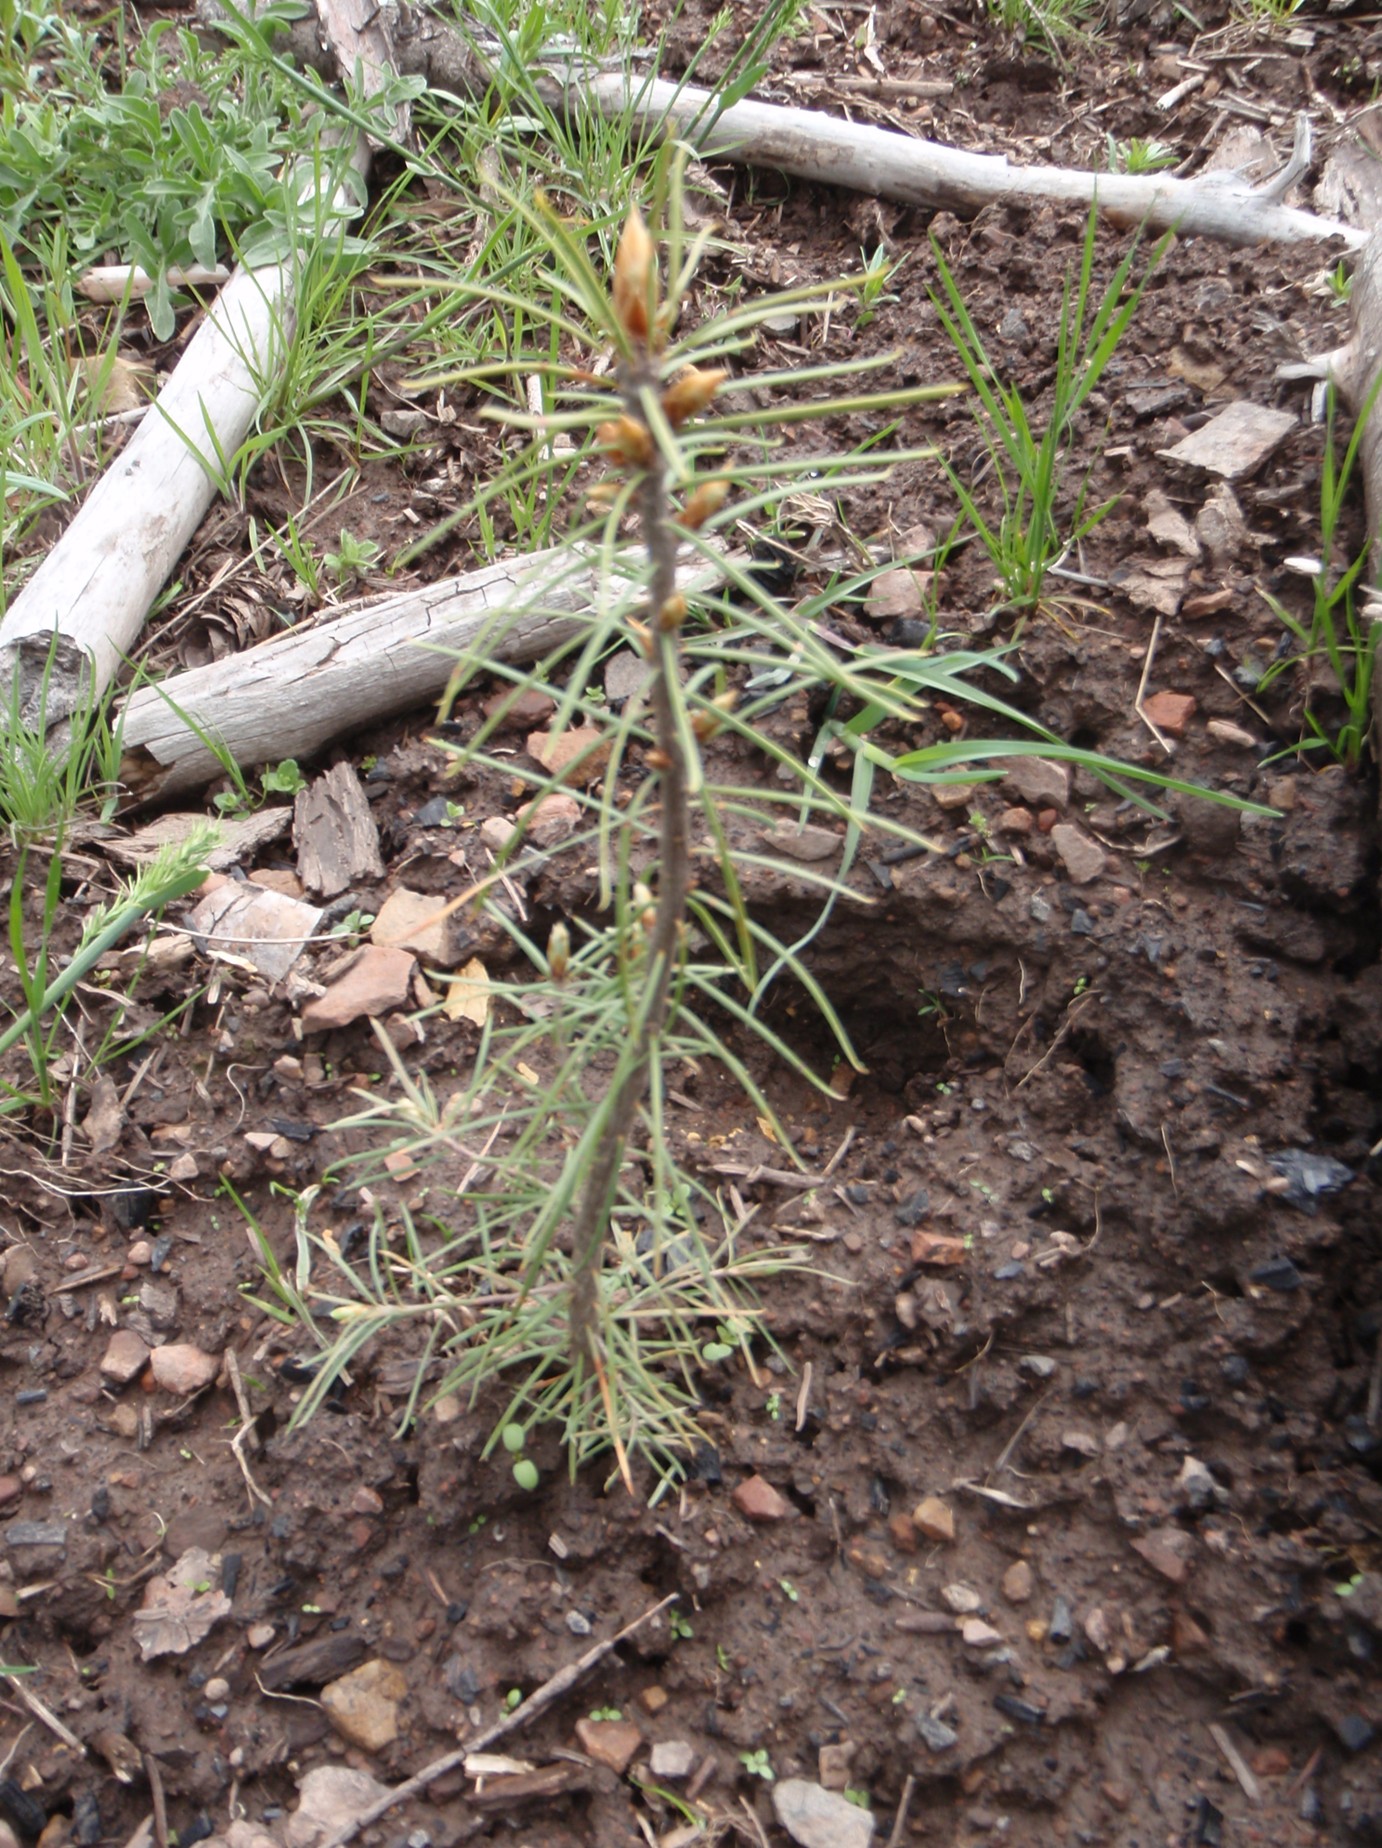
Instead, he proposed that carrying capacity was primarily governed by the tree size (diameter) and density (trees per unit area) relationship, influenced by species-specific traits like shade tolerance. For instance, Pinus species, less tolerant of low light interception, will self thin faster under higher stand densities than more shade-tolerant Abies species. Thus, forest carrying capacity was expressed as a function of species and their ability to thrive under decreasing light conditions.
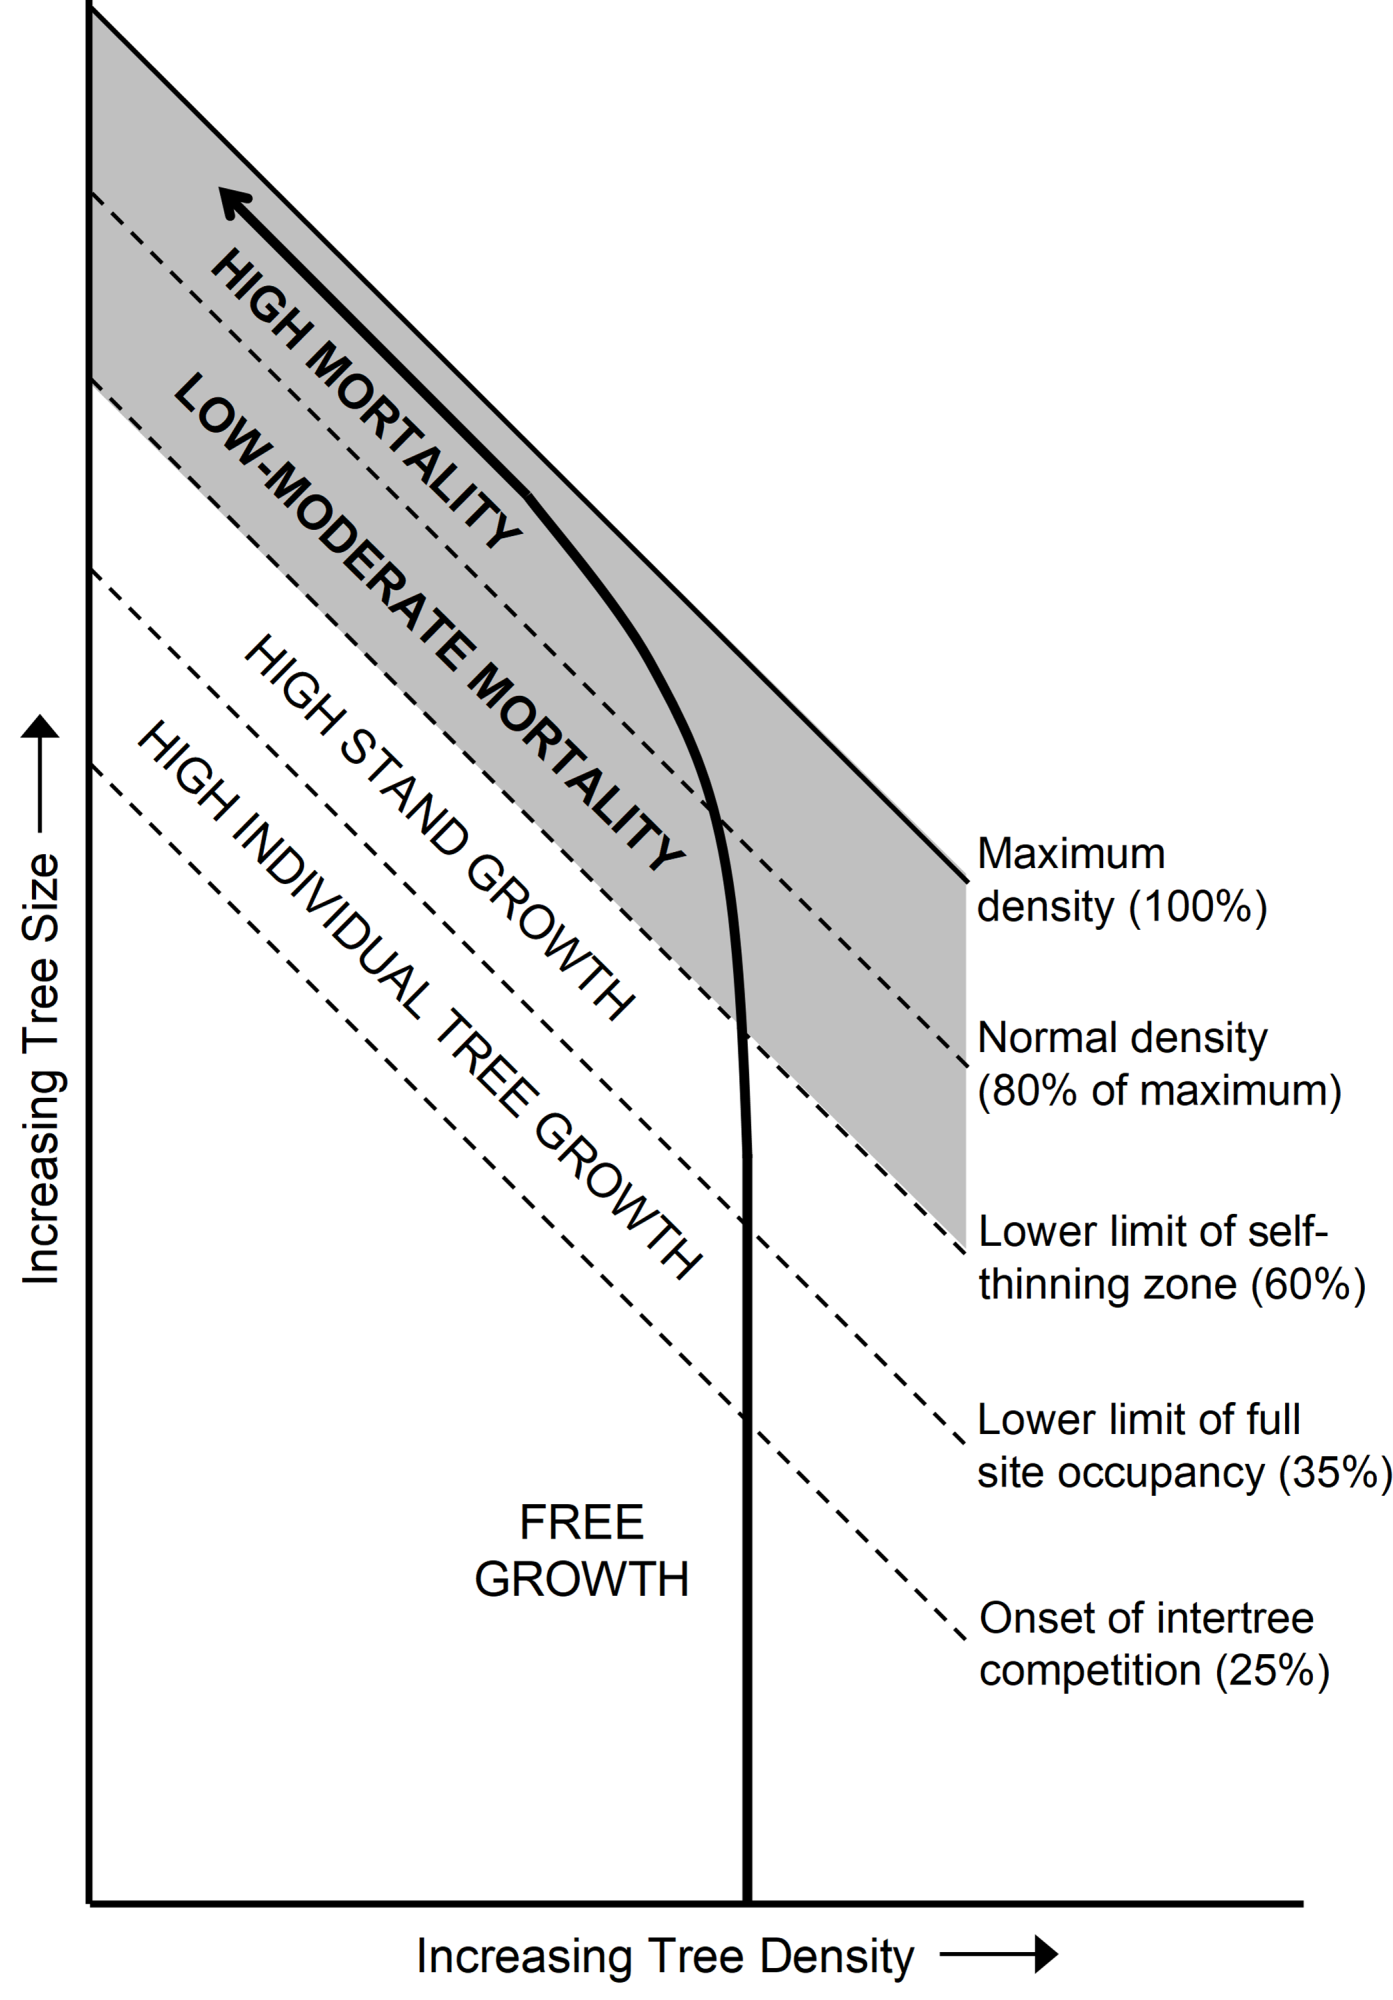
This relationship was formalized in the Stand Density Index (SDI) formula: SDI = TPH × (QMD/25.4)^1.605, where TPH is trees per hectare within a stand, and QMD is the stand’s quadratic mean diameter at breast height, standardized to a proportion of the index diameter 25.4 cm. The exponent 1.605 represents the rate of decline in tree density as diameter increases. The maximum SDI (SDImax) for a species was historically determined by analyzing TPH and QMD data pairs using methods such as 95th percentile slope fitting. Forest managers calculate a stand’s relative density (RD = SDI/SDImax) to assess current conditions and apply silvicultural treatments to prevent density-dependent mortality, ensuring forest health and productivity (Fig. 1).
In the late 20th century, advancements in big data, statistical modeling, and spatially explicit site resource data (climate, soil, topography) challenged the idea that species alone control SDImax. Research from the University of Idaho and elsewhere (Powell 1999; Andrews et al. 2018; Kimsey et al. 2019; Heiderman and Kimsey 2021) demonstrated that both species and site-specific factors must be considered when determining maximum forest carrying capacity.
Mapping U.S. forest carrying capacity
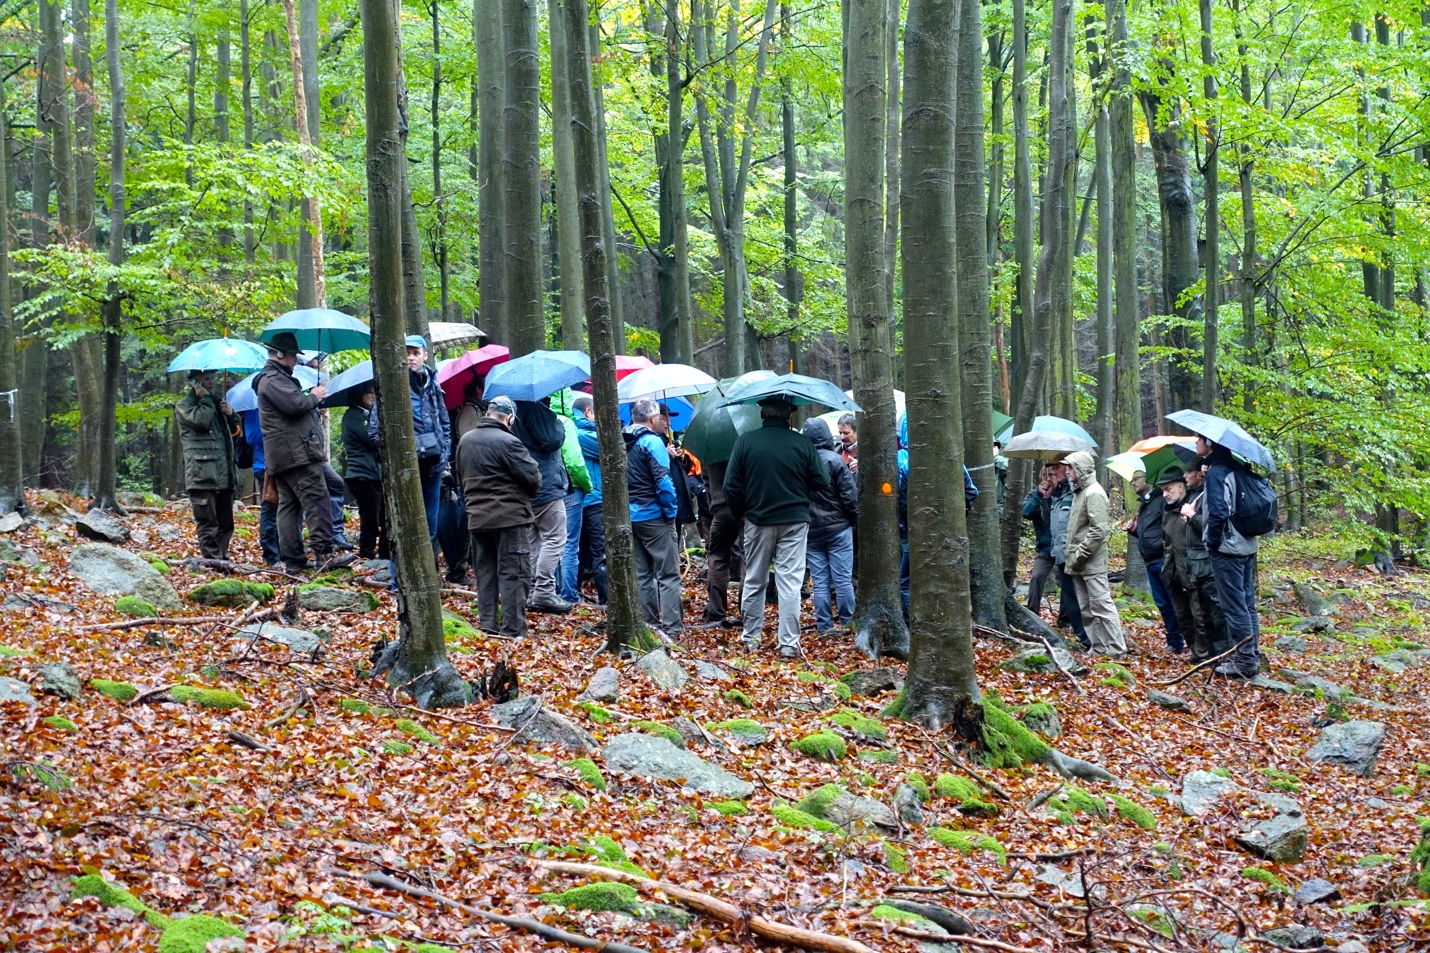
With dynamic climates, increased forest utilization, and disturbances like wildfires, insect outbreaks, harvesting, and urbanization, forest managers need scalable tools for density management to restore and enhance forest resources. Predicting and mapping forest carrying capacity (SDImax) as a function of site and species is critical for these efforts.
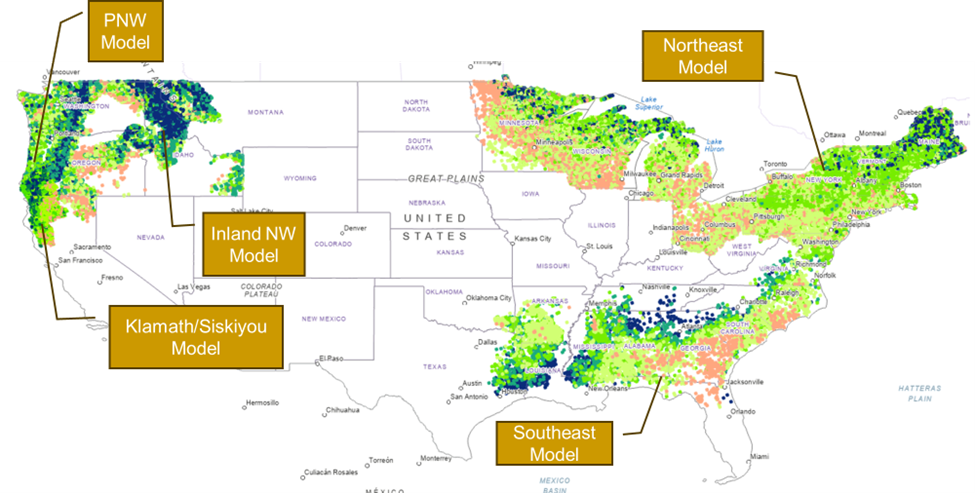
Supported by the National Science Foundation’s Center for Advanced Forestry Systems and the University of Idaho’s Intermountain Forestry Cooperative, forest carrying capacity models were developed for key U.S. forest ecosystems: the mixed conifer forests of the Pacific Northwest and Rocky Mountains, loblolly pine ecosystems in the Southeast, and mixed conifer/hardwood forests in the Northeast and Lake States (Fig. 2).
These models were built using a vast dataset of over 350,000 inventory plots from federal, state, and industrial forest management organizations. Advanced machine learning techniques, including Minimum Redundancy Maximum Relevance (MRMR) feature selection and Quantile Gradient Boosted Machine (QGMB) modeling, were employed to estimate SDImax based on physiographic and stand variables unique to each region. Key factors included the species’ shade and drought tolerance, species diversity, soil characteristics, topography (elevation and solar radiation), and climate variables such as annual and growing season precipitation, precipitation as snow, frost-free period length, and temperature extremes.
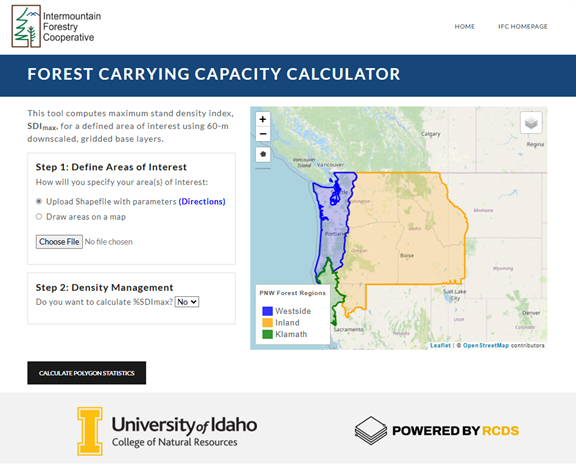
The resulting models and site feature raster grids were integrated into user-friendly tools tailored to organizational workflows, including a web application (Fig. 3), an ESRI ArcPro toolbox add-in, and Jupyter Notebook- Python code for database integration. These tools enable forest managers to map carrying capacity at landscape and management-unit scales.
Additionally, the climate-driven nature of these models has allowed researchers at the University of Idaho to project how shifts in temperature and precipitation may affect future forest carrying capacity (Heiderman and Kimsey 2023). These tools provide forest managers with spatially and temporally explicit guidance for site-specific density management, adaptable to current or future conditions.