This article by G. Allan Johnson, Ph.D., focuses on advanced MRI techniques for studying neurodegenerative diseases, exploring the challenges of screening therapies for conditions like Alzheimer’s and Parkinson’s, and highlighting the promising research conducted at Duke University
Neurodegenerative diseases, e.g., Alzheimer’s, Parkinson’s, Huntington’s, are increasing at alarming rates as the population ages. Researchers in academia and industry are generating hundreds of promising new therapeutic leads. But a major bottleneck is effective frontline screening. MRI has been a go-to method for following neurologic disease and response to therapy. But clinical trials are complex and costly. Preclinical trials are much more cost-effective, but MRI of mice and rats requires significantly (3000X) higher spatial resolution. Scientists at Duke University have recently demonstrated 3D MRI in mouse models of neurodegeneration at a spatial resolution 2.4 million times that of clinical MRI, with high-throughput methods to reduce the effort to evaluate new therapies. Imaging pipelines built on high-performance computing generate quantitative multi-parametric statistical atlases of genetically curated models with an enormous increase in efficacy.
Magnetic resonance histology (MRH)
Paul Lauterbur, who received the 2003 Nobel Prize in Medicine for the discovery of MRI, concluded his seminal paper with, ‘Zeugmatographic (imaging) techniques should find many useful applications in studies of the internal structures, states, and composition of microscopic objects.’ (1) Professor Lauterbur realized in 1973 that MRI could be scaled to microscopic resolution. Scientists at the Duke Center for In Vivo Microscopy (CIVM) have spent the last 40 years reducing that vision to practice. It is now possible to create microscopic 3D images of the mouse brain with populations sufficient to derive statistical atlases that map neurodegeneration, inflammation, and demyelination across the whole brain. Magnetic resonance histology (MRH), i.e., microscopic MRI of postmortem specimens, was first suggested in 1993. (2) It provides four unique attributes: 1) MRH provides unique soft tissue contrast, highlighting multiple cytoarchitectural measures of tissue health. 2) MRH is nondestructive; after scanning, the tissue can be processed for conventional microscopy, proteomics, etc. 3) MRH is three- dimensional. 4) MRH is inherently digital, lending itself to sophisticated analysis, e.g., statistical atlasing, AI, and connectomics.
The mouse connectome scanner
The first high-performance (human) connectome scanner was constructed in 2011 using a 3T magnetic resonance imaging (MRI) system with specialized gradient coils to allow diffusion MRI (dMRI) with 1.5 mm3 voxels. (3) In contrast, the mouse connectome scanner developed at Duke employs a 9.4T magnet with gradients that are ten times stronger, achieving resolution down to 15 μm voxels that are 1,000,000 times smaller than those in the human system. (4) Simply trying to replicate what has been done in the clinical domain in the preclinical domain is a fool’s errand. Our goal has been to construct hardware, software, and data processing systems, along with statistical analysis, to achieve the highest resolution possible, making this technology accessible for preclinical studies in neuroscience. Specialized radiofrequency coils and tissue handling hardware have been constructed. We have capitalized on compressed sensing to accelerate acquisition, and a high-performance compute cluster is used to denoise and remove registration artifacts arising from the exceptionally strong gradients.
Diffusion tensor imaging (DTI)
DTI employs strong gradients to encode the direction and magnitude of water diffusion. Diffusion along an axon is much faster than diffusion across the axon since the walls of the axon are wrapped in myelin, which constrains the diffusion. Deterioration of the myelin, which occurs with age and in many diseases, can be measured along with changes in the number, density, size, and direction of axons. Diffusion in a live intact cell is 10X lower than in a dead cell. The magnitude and direction of diffusion provide a rich set of physical properties, offering a direct read of brain cytoarchitecture. Figure 1 shows examples of diffusion MRI (dMRI) images from the Duke Mouse Brain Atlas (5) (https://bit.ly/dmba-2025)
Big Data – Diffusion imaging generates massive datasets (300 GB/specimen). A typical study with 24 animals might generate over 7 TB of data. CIVM data analysts have created a high- performance Big Data environment featuring a 1000-processor cluster, multiple high-performance servers with 2TB of memory, and a petabyte archive. Imaging pipelines automate post-processing, reconstruction, registration, denoising, and diffusion tensor calculation, among other tasks, to support high throughput and minimize operator errors. (4)
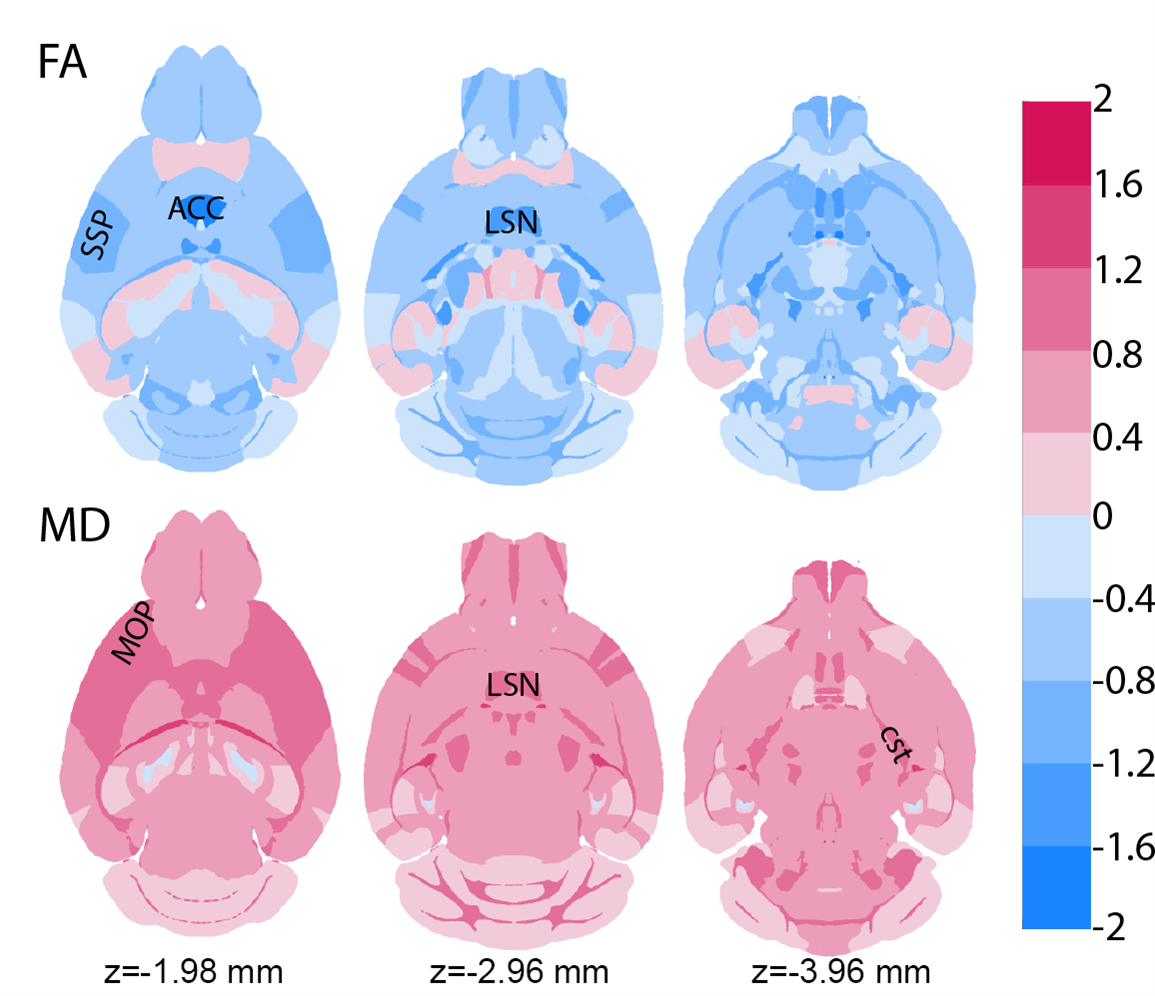
A registration pipeline automates labeling of every specimen with 180 anatomical regions of interest on each hemisphere. Pipelines automatically extract the means and standard deviations of ten different image phenotypes from all these ROIs for every specimen, including the volume of the ROI, mean diffusivity, fractional anisotropy, etc., creating a summary of over 2000 image-derived phenotypes for every brain. The computational infrastructure generates multiple anova differences in 231 ROI across the whole brain. Figure 2 shows a statistical image from a study of Alzheimer’s disease using over 400 specimens from 30 different BXD strains of mice, including both those with and without the 5XFAD transgenes. Three axial images from the whole-brain statistical atlas at reference levels -1.98, -2.96, and -3.96 mm relative to bregma show the differences between a population (n = 18) of 14-month-old BXD77 mice with and without the 5XFAD transgenes.
The color scale represents Cohen’s D, i.e., the differences in mean normalized against the standard deviation. Red indicates an increase and blue indicates a decrease. Two of the ten diffusion metrics are shown. Fractional anisotropy changes with age and in the presence of AD. In this example, there is reduced FA in SSP (@-1.98 mm) and LSN (-2.96 mm), decreased FA and increased MD in primary somatosensory cortex (SSP), increased MD in primary motor cortex (MOP) and lateral septal nucleus (LSN); decreased FA and increased MD in cortical spinal tract (cst) (-2.96 and -3.96 mm) with effect size >1.2 selecting regions of interest for further attention. Since the MRH volumes are acquired with the brain in the skull, statistical atlases of volume changes provide direct measures of atrophy. Connectomes, i.e., matrices showing connectivity between the roughly 200 x 200 ROI, give a view of the brain networks with new insight that cannot be derived from traditional histology.
Professor Lauterbur’s vision was clear in 1973. The extension of MRI to MRH has required significant technological development. However, the requisite barriers have been addressed, so MRH is now routine, providing radically new and more efficient methods for evaluating treatments for neurological diseases.
Support: NIA R01AG070913, NIMH R01NS120954-01A1
References
- Lauterbur, P. Image formation by induced local interactions: examples employing nuclear magnetic resonance. Nature 242, 190-191 (1973).
- Johnson, G. A. et al. Histology by magnetic resonance microscopy. Magn Reson Q 9, 1-30 (1993).
- Fan, Q. et al. MGH-USC Human Connectome Project datasets with ultra-high b-value diffusion MRI. Neuroimage 124, 1108-1114 (2016). https://doi.org:10.1016/j.neuroimage.2015.08.075
- Johnson, G. A. et al. Merged magnetic resonance and light sheet microscopy of the whole mouse brain. Proc Natl Acad Sci U S A 120, e2218617120 (2023). https://doi.org:10.1073/pnas.2218617120
- Mansour, H. et al. The Duke Mouse Brain Atlas: MRI and light sheet microscopy stereotaxic atlas of the mouse brain. Sci Adv 11, eadq8089 (2025). https://doi.org:10.1126/sciadv.adq8089