Should public company pay be more like private equity fund pay? This analysis compares incentive structures, retention, and shareholder cost, exploring how formula-based pay plans improve alignment, leverage, and value creation for investors in both corporate models
Public companies and private equity funds have many common investors, and these investors share common goals for their asset managers’ pay. They aim to create strong incentives to enhance shareholder value, retain key talent, and minimise shareholder costs. And the teams managing their assets in public companies and private equity funds face similar demands; they need to monitor their business units to ensure they add value, and they buy and sell business units to add value. But despite common ownership, shared pay objectives, and similar management responsibilities, public companies and private equity funds have very different pay systems.
Public companies are focused on maintaining target dollar pay that is competitive in the labour market, aiming for a high percentage of pay at risk and limiting the impact of market and industry factors on pay. Private equity fund pay is focused on fixed sharing and front-loaded incentives. It typically provides for an annual fee of 2% of committed capital and a 20% carried interest, that is, a 20% share of the gains achieved by the fund.
This paper presents a common framework for measuring the success of the two approaches in achieving the three basic objectives.
A new framework to measure 3 objectives
Our framework for measuring success in achieving the three basic objectives of management compensation was originally developed for public companies more than ten years ago. (1) It plots relative market-to-market pay vs relative TSR for each company using 5+ years of data and then calculates the regression trendline. The slope of the trendline, what we call “pay leverage”, is a measure of incentive strength, the first of the three basic objectives. It measures the percent change in relative pay associated with a 1% change in relative shareholder wealth. The intercept, where the trendline crosses the vertical axis at zero relative TSR, is a measure of performance-adjusted cost.
It measures the pay premium at peer group average performance. It provides a negative measure of retention risk, that is, the risk of not retaining key talent – the second basic objective – and a positive measure of shareholder cost – the third basic objective. (2) This analysis originally required complex and time-consuming estimates of mark-to-market pay calculated from the grant data reported in the proxy statement. Now, the analysis can be done easily using the mark-to-market pay data reported in a public company’s proxy statement disclosure of Pay Versus Performance.
We have extended our pay vs. performance analysis to private equity fund pay in two ways. First, we simulate pay for public company CEOs using the pay mix and structure of private equity funds. In these simulations, we assume that the CEO has “x and 10x” pay, i.e., annual fixed pay of $x and a ten-year upfront at-the-money option on $10x of stock. We solve for x to ensure that the present value of expected future pay for the CEO equals the present value of market pay for the CEO. We measure relative TSR using peer group performance, adjusted for the company’s industry beta. Second, we simulate the full 2 and 20 formula and assume that the private equity fund CEO gets the same share of total payroll, i.e., the total fee generated by the 2 and 20 formula, as a public company CEO in capital markets (GICS industry group 4020) receives of an equally large payroll. For these simulations, we assume that the fund has a portfolio of ten similarly sized companies, and we measure relative TSR using market performance, adjusted for the company’s market beta.
Our key findings
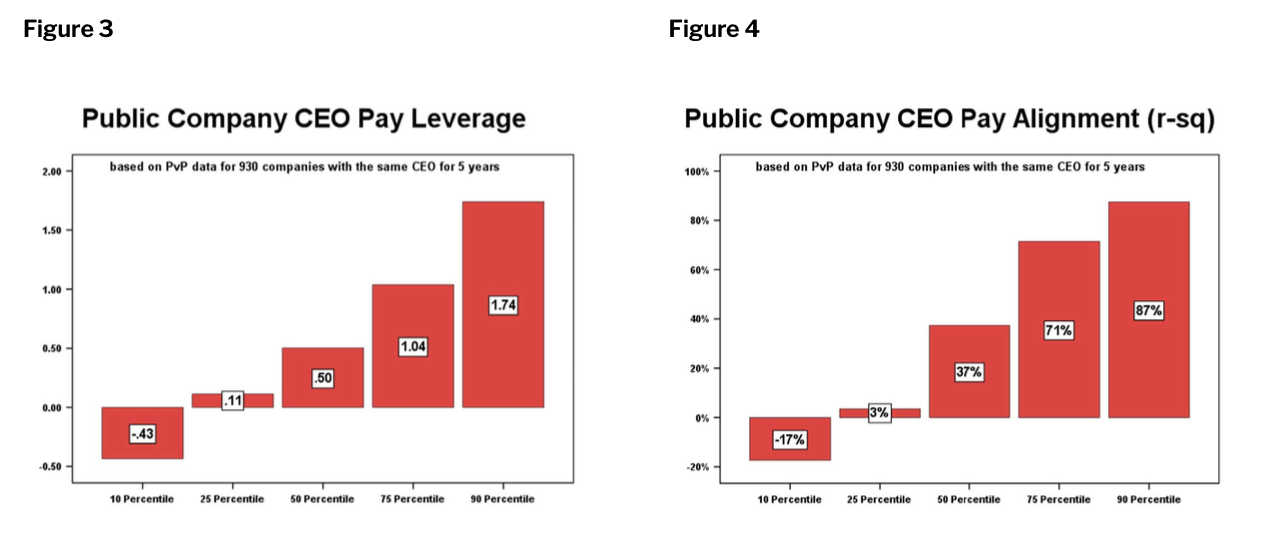
Public companies often struggle to achieve the three basic objectives. Median public company CEO pay leverage is only 0.5, and relative TSR only explains 37% of the variation in relative pay for the median public company CEO. Only 13% of companies have high alignment with limited retention risk and limited shareholder cost.
It is possible to design a formula-based pay plan for public companies – one that can be compared with formula-based private equity fund pay – that provides a perfect correlation of relative pay and relative TSR and gives the CEO the same pay leverage, pay alignment and performance-adjusted cost across all performance outcomes. This perfect correlation pay plan, which provides annual grants of performance shares, departs from conventional CEO pay practice in two ways. First, target pay is market pay adjusted for trailing relative performance, not market pay regardless of trailing relative performance. Second, vesting takes out the industry component of the stock return. (3) Conventional vesting measures, such as [1 + relative TSR], amplify the industry component of the stock return instead of removing it. (4)
Private equity fund pay, despite using the same formula for all funds, fails to provide the same pay leverage, pay alignment and performance-adjusted cost across all performance outcomes. Pay dimensions vary with TSR and TSR volatility. Pay leverage at the 90th percentile is 20x greater than it is at the 10th percentile, and pay leverage at the 75th percentile is 2.8x greater than it is at the 25th percentile. But, despite this variability, private equity fund pay provides more consistent incentives than public companies do. The public company CEO pay leverage at the 75th percentile is 9.5 times greater than it is at the 25th percentile.
The pay mix and structure of private equity fund pay does a better job than the average public company of achieving the three basic objectives. 39% of the simulated x and 10x plans provide high alignment with limited retention risk and limited shareholder cost, while only 13% of public companies do the same. (5) The x and 10x pay plan does this even though it rewards the gross return, not the relative return, and has a lower percent of pay at risk than the median public company. It provides a strong incentive and high alignment because the carried interest is front-loaded. An x and annual 1x pay plan that provides an annual grant of carried interest on stock reduces pay leverage by half and pay alignment (r-sq) by three-quarters. The x and 10x pay plan would be even more cost-efficient if it provided a carried interest in the relative return.
The full 2 and 20 formula has a very high cost. At the 90th percentile, our 2 and 20 pay plan simulations indicate that the CEO pay premium at expected performance is 127% higher than that of public companies and 409% higher than that of x and 10x pay plans. (6)
Public company pay used to be more like private equity fund pay
While public company and private equity fund pay are currently quite different, one focusing on target dollar pay and the other on a target share of value added, public company pay in the first half of the twentieth century was much more like current private equity pay. In 1922, General Motors adopted an incentive plan that made the bonus pool equal to 10% of profits exceeding a 7% return on capital. GM used this plan without any change for 25 years and used the basic concept of fixed sharing in an economic profit pool from 1918 to 1982. The bonus pool covered both cash and stock incentive awards for everyone who received a bonus at GM. GM executives also received base salaries, so executive pay at GM was similar to private equity pay in having “fixed” pay and a fixed share of a value-added measure. Most other public companies had similar plans.
Our framework for evaluating public company pay
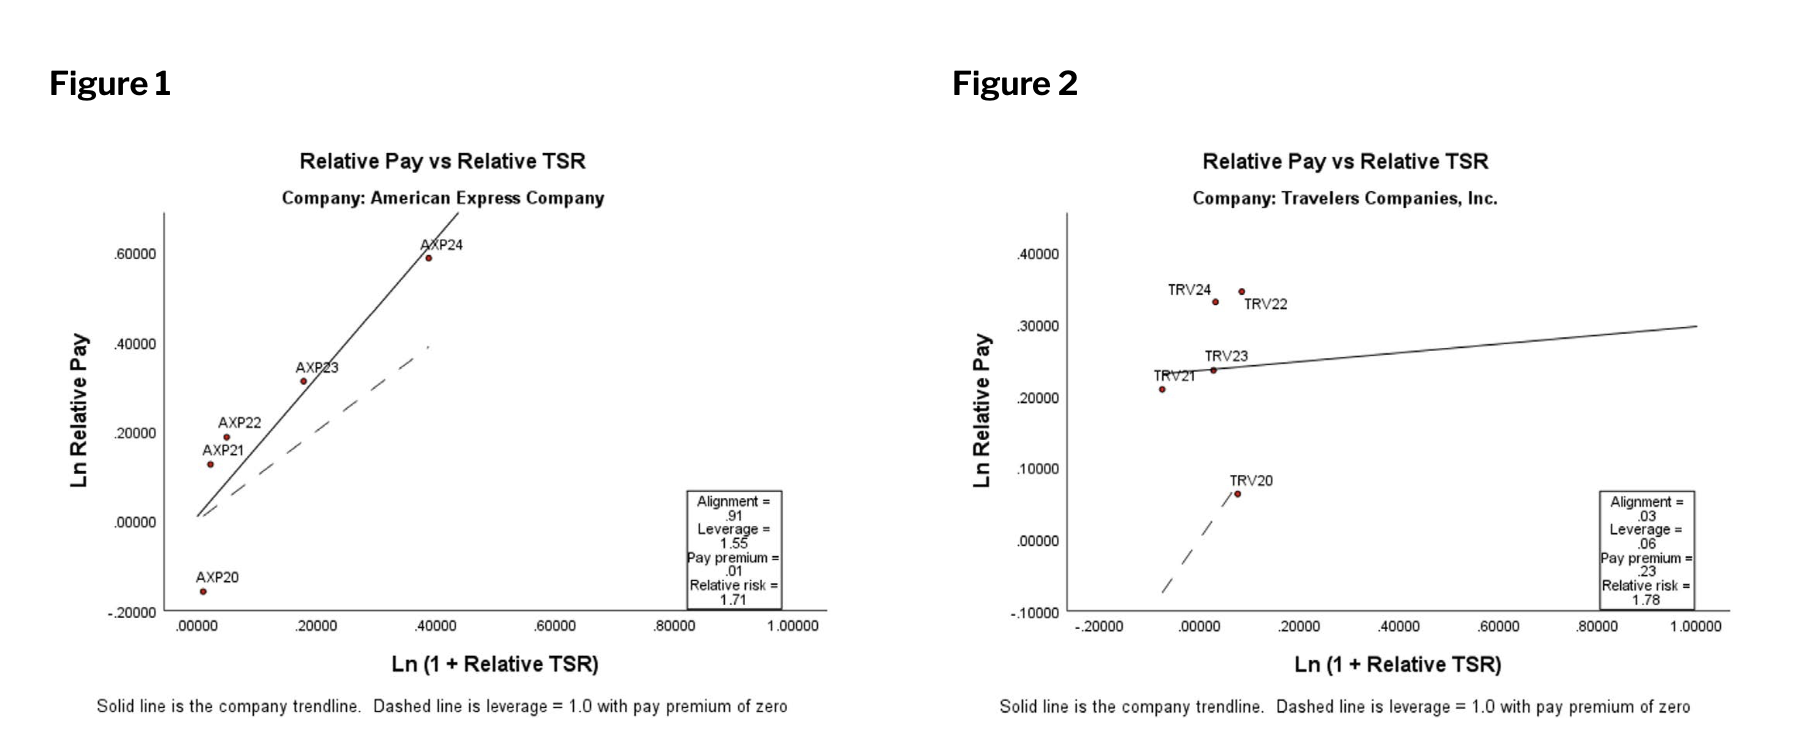
Figure 1 shows relative pay and relative TSR for American Express CEO Stephen Squeri for the years 2020-2024. The vertical axis shows the natural log of relative cumulative pay for each of the five years 2020-2024. Relative cumulative pay is mark-to-market pay divided by the future value of cumulative market pay. Mark to market pay values unvested equity compensation based on the year-end stock price and the number of shares expected to vest. The mark-to-market pay for 2020-2024 comes from American Express’s “Pay Versus Performance” disclosure in its 2024 proxy statement. Market pay is average pay for the same position, industry, and company size, measured at the start of the five-year period. We estimate market pay for Squeri, $26.4 million, using a regression that relates the natural log of total compensation to the natural log of company revenue. (7) American Express’s GICS industry is Consumer Finance. Market pay is a present value number, while mark-to-market pay is a future value number; therefore, we need to increase market pay to account for its expected annual accretion. Our annual accretion factor for American Express is 4.3%. (8)
The horizontal axis in Figure 1 is the natural log of (1 + relative cumulative TSR). The plot points show cumulative performance for each of the five years, 2020-2024. Relative TSR is [(1 + company TSR)/ (1 + peer group TSR)] – 1. Company TSR and peer group TSR are both reported in American Express’s Pay Versus Performance disclosure. American Express’s peer group is the S&P Financial Index, a sub-sector of the S&P 500. (9)
Figure 2 shows the same graph for Travelers’ CEO Alan Schnitzer. (10) Market pay for the Travelers CEO position is $24.0 million. Travelers’ industry is Insurance, and its peer group is a group of 13 financial, predominantly insurance, companies selected by Travelers.
The slope of the trendline shows the sensitivity of pay to performance, what we call “pay leverage”. Figure 1 shows that Squeri has a pay leverage of 1.55, while Figure 2 shows that Schnitzer has a pay leverage of only 0.06. This means that a 1% increase in relative shareholder wealth increases Squeri’s pay by 1.55% but only increases Schnitzer’s pay by 0.06%. In other words, the financial incentive provided by pay is 26x greater for Squeri than it is for Schnitzer. The correlation between relative pay and relative TSR, which we refer to as “pay alignment,” is much higher for Squeri, 0.91, than it is for Schnitzer, 0.03. This means that relative TSR explains 83% (= 0.91 x 0.91) of the variation in relative pay for Squeri, but 0% (= 0.03 x 0.03) for Schnitzer. The intercept, that is, the point where the trendline crosses the vertical axis arising at zero, measures the pay premium at industry-average performance. It’s 0.01 for American Express and 0.23 for Travelers. Both premiums are stated in natural logs, but we can easily convert them to percentage premiums, 1% for American Express and 26% for Travelers. (11)
While the differences between Squeri and Schnitzer are substantial, the two executives are far from representing the extremes of the distribution of leverage, alignment, and the pay premium at industry-average performance. Figures 3 and 4 show the distribution of CEO pay leverage and pay alignment (r-sq) for 930 companies with the same CEO for the five years 2020-2024. (12) Squeri’s pay leverage of 1.55 falls at the 85th percentile, while Schnitzer’s pay leverage of 0.6 falls at the 20th percentile, so 35% of the sample have pay leverage greater than Squeri or lower than Schnitzer. Similarly, Squeri’s pay alignment of 0.91 falls at the 85th percentile, while Schnitzer’s pay alignment of 0.03 falls at the 20th percentile, so, again, 35% of the sample have pay alignment greater than Squeri or lower than Schnitzer. Their difference in the pay premium at peer group average performance is much smaller. Squeri’s pay premium of 0.01 falls at the 50th percentile, while Schnitzer‘s pay premium of 0.23 falls at the 65th percentile.
The conventional wisdom that the three basic objectives of executive pay can be achieved by having a high percentage of pay at risk, while maintaining target pay at the 50th percentile, is widely accepted. The low level of median alignment (r-sq) and the wide dispersion in the pay premium at industry average performance suggest that the conventional wisdom is not effective for most companies. Only 41% of the 930 companies have alignment (r-sq) greater than 50% (13), and only 13% of the 930 companies have high alignment with limited retention risk, i.e., a pay premium at industry average performance no lower than -25%, and limited shareholder cost, i.e., a pay premium at industry average performance no greater than +25%.
The perfect correlation pay plan says that target pay should be perfectly correlated with trailing relative performance and that the difference between the vesting stock value and the granted stock value should be perfectly correlated with the relative return from the grant date. The relative pay versus relative performance framework enables us to measure these two correlations and better understand where conventional wisdom falls short. To measure the correlation between target pay and trailing relative performance, we use grant date pay – the pay reported in the Summary Compensation Table – as a proxy for target pay and measure the correlation between relative grant date pay and relative TSR. To measure the correlation of the difference between vesting and granted stock value and relative TSR, we use the difference between relative mark-to-market pay and relative grant date pay and measure the correlation between the difference and relative TSR.
The median correlations with relative TSR are 0.61 for mark-to-market pay, 0.25 for SCT pay and 0.37 for post-grant date pay changes. At the median, mark-to-market pay alignment is roughly the sum of its two components, SCT pay alignment and post-grant date pay change alignment, since 0.25 + 0.37 = 0.62. The theory of the conventional wisdom is that a company can achieve perfect alignment with relative TSR through perfect alignment of post-grant date pay changes with relative TSR; the correlation of target pay with relative TSR can, and should, be zero to ensure that the company achieves its retention and cost objectives. In other words, the conventional wisdom expects the mark-to-market pay alignment = 0 x SCT alignment + 1 x post-grant date pay change alignment.
The data show that it’s difficult to achieve the conventional wisdom that SCT pay alignment should be zero and post-grant date pay change alignment should be 1.0. 64 of 930 companies have post-grant date pay change alignment greater than 0.9, with an average of 0.94. But the average mark-to-market pay alignment of these companies is only 0.71. This means that relative TSR explains only 50% (= 0.71 x 0.71) of the variation in relative pay, even though post-grant date pay change alignment is 0.94. The problem with these 64 companies is that their SCT pay alignment is much lower than zero. They have a median SCT pay alignment of -0.55 and a mean SCT pay alignment of -0.30.
Empirical analysis of correlations for the 930 companies shows that the best fit formula for mark-to-market pay alignment is 0.77 x SCT pay alignment + 0.87 x post-grant date pay change alignment. This formula shows that the mean negative SCT alignment of the 64 companies, -0.30, reduces their expected mark to market pay alignment by -0.23 (= 0.77 x -0.30), bringing it down to their actual mean mark to market pay alignment, 0.71 = (0.94 – 0.23). When we use this formula to calculate the SCT alignment companies need to achieve a mark-to-market pay alignment of 1.0, given their actual post-grant date pay change alignment, we find that the median company needs SCT alignment of 0.68 to achieve perfect mark-to-market pay alignment. This is 2.7 times greater than the median company’s actual SCT pay alignment of 0.25. This shows that companies will struggle to achieve high levels of mark-to-market pay alignment unless they abandon their competitive pay policies and make target pay more performance-sensitive.
Adapting our pay vs performance analysis to x and 10x
We’ll use American Express and Travelers as examples again and model the x and 10x pay plan for the ten years 2014-2023. (14) At the end of 2013, the market pay for the American Express CEO was $24.8 million, based on American Express’s market equity value of $97.8 billion, and the ten-year present value of market pay is $170.3 million. (15) We can solve for the asset fee (AF) and carried interest that have the same present value if we know the Black-Scholes ratio value, i.e., the ten year at the money option value as a percent of the beginning stock price, 0.55 for American Express in 2013, and the present value of an annual payment of $1 for ten years, 6.86. (16) The annual asset fee is $13.8 million, and the carried interest provides a ten-year at-the-money option on $137.8 million in stock. The expected value of the carried interest is $75.8 million (= $137.8 million x 0.55), so the x and 10x pay plan has only 45% (= 75.8/170.3) of pay at risk on a present value basis.
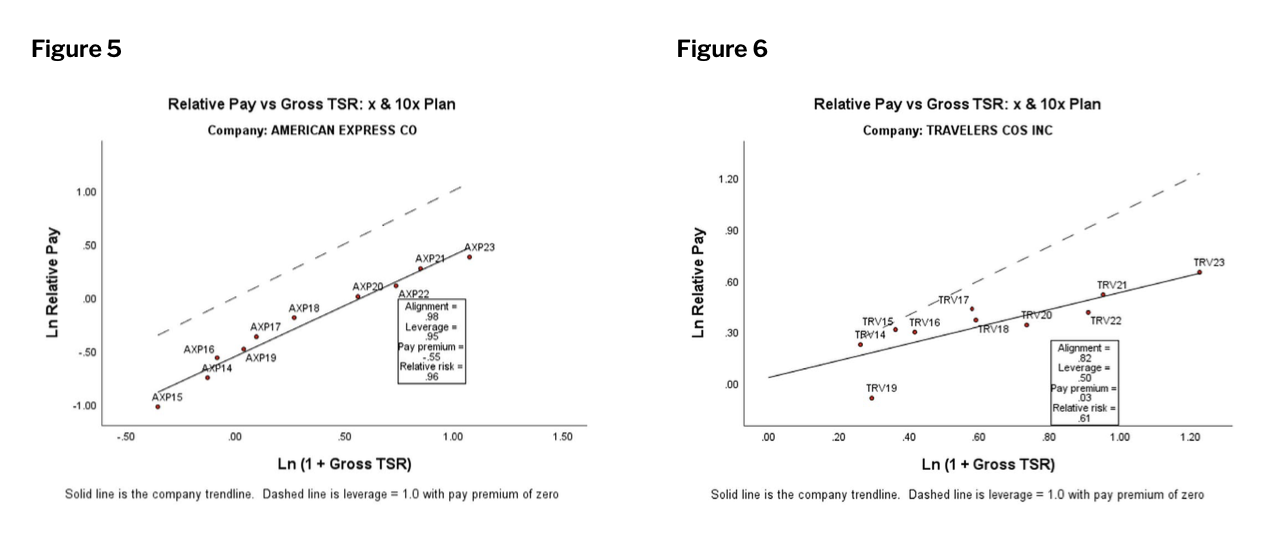
Figures 5 and 6 show x and 10x pay dimensions for American Express and Travelers measured against gross, not relative, TSR. Both simulations use the same payment formula, so it’s surprising that pay leverage for American Express, 0.95, is almost twice as great as pay leverage for Travelers, 0.50. This shows that x and 10x pay don’t provide the consistency of the perfect correlation pay plan. It does not provide the same leverage and alignment regardless of performance.
Our simulations, which utilise 21,453 ten-year periods, show that gross return pay leverage ranges from 0.31 at the 10th percentile to 0.88 at the 90th percentile, while gross return alignment ranges from 0.57 at the 10th percentile to 0.98 at the 90th percentile. Performance has a big impact on gross return leverage and alignment. One easy way to see this is to compare gross return pay leverage for companies where the carried interest is never in the money with all other companies. Median pay leverage for “never in the money” carried interest companies is only 0.22, compared to 0.65 for companies where the carried interest is in the money at the end of at least one year. The impact of performance on pay leverage is complicated because better performance has both positive and negative effects on pay leverage. Better performance has a positive effect because it increases the expected value of the carried interest, and hence, increases the weight of performance- sensitive pay relative to fixed pay. But better performance also has a negative effect on pay leverage because the carried interest is an option. Option leverage is 1.6 for a ten-year at-the-money option for a company with median volatility (0.32), but this leverage declines to 1.1 if the stock price is 10 times the exercise price after 5 years.