Focusing on atomic-force microscopy (AFM) data, Nancy A. Burnham examines the challenges in image processing for scientific research, highlighting how different techniques yield varied images and clearer views of key features. The choices researchers make during processing can therefore lead to differing conclusions, underscoring the importance of critical evaluation in scientific publications
Judgement in image processing
Research scientists often use images as a means of communicating results. Inevitably, there are judgement calls to be made in the processing of images from the raw data to a scientific publication. But to what extent is one’s judgement correct?
This thought brings up the modern phenomenon of images created or manipulated by Artificial Intelligence. The challenge of distinguishing what is real from what is not is particularly difficult in the context of AI-generated images, and it is a genuine societal concern.
In this article, the focus is more restricted and tractable to provide an example of how what should be the simpler case of scientific images based on experimental data is often not. The spotlight is on image processing and interpretation of atomic-force microscopy (AFM) data, an aspect of current research on how materials behave at the nanoscale, a size range smaller than the wavelength of light.
Collection of raw data
An AFM works much like your fingers when you enter a dark room and are searching for the light switch on the wall. You scan your hand back and forth on the wall, feeling for topography. But instead of your finger radius of about a half to one centimeter, the radius of an AFM ‘finger’ is about five to ten nanometers, one million times smaller. The AFM tip is mounted on a flexible beam. The beam deflection is tracked with a laser and a position-sensitive photodiode as it is raster-scanned back and forth across a sample. This information forms images like those in Figure 1, where the scan range is 15 microns (a few times smaller than the diameter of a human hair) and the color scale represents height.
Scientists are usually interested in small features on their sample surfaces, often less than a micron high. A sample might be a centimeter across. It isn’t easy to place a sample in an AFM perfectly horizontally. Often, the height difference between one side and the other of a one-centimeter sample is on the order of one hundredth of the sample size, or 100 microns – a greater height change than the features of interest in AFM studies. Additionally, the scanning mechanisms in AFMs often do not move exactly as programmed. To see the features of interest, the background topography must be subtracted and scanner imperfections compensated for. But how?
Processing the raw data
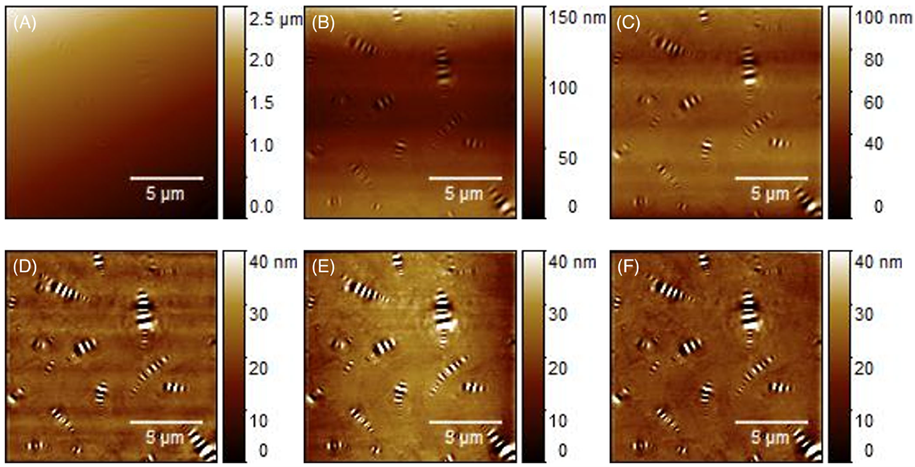
Figure 1 shows various options for processing raw, sloped AFM data to reveal the wavy features of interest on a bitumen surface (bitumen binds the materials in roads together). Figure 1A is the initial image, sloped from top left to bottom right by 2.5 microns (μm). Figure 1B is the result of fitting a plane to 1A and subtracting it, leaving a valley across the middle of the image that is about 100 nanometers (nm) deep. If instead a parabola is fit to 1A, the result is 1C, where three smaller valleys of about 50 nm depth can be seen running left to right. Taking the idea of a parabolic subtraction further, in 1D an eleventh-order mathematical function was subtracted from 1A. Now the wavy features of the bitumen become more evident. But the background shows multiple horizontal undulations; they are not physical, as this sample was prepared by melting, spreading it on a substrate, and letting it cool; the background should be smooth. In 1E, a different approach was taken: horizontal row alignment was applied to 1B (the planar fit), resulting in the appearance of a central vertical bulge. Finally, 1F results from horizontal row alignment of 1C, where the background is smooth and flat, and the wavy structures are easy to further examine. Figure F is the ‘real’ one.
Consequences of researchers’ choices
If a researcher used 1D to examine the wavy structures in detail rather than 1F, the heights of the wavy structures would differ slightly from those in 1F, and the background would also be wavy, possibly leading to a different scientific conclusion.
This example shows how many decisions are sometimes made in a ‘simple’ image processing step, where the judgement of researchers may vary. Indeed, the publication from which Figure 1 is taken was written because of this author’s concern that other authors had not been sufficiently critical in their image processing and subsequent interpretation. Readers are thus cautioned that even ‘real’ data may not appear the same, depending on a researcher’s choices during the processing.