
Executive pay has three basic objectives: provide strong incentives to increase shareholder value, retain key talent and limit shareholder cost
The conventional wisdom, widely embraced by boards, compensation consultants and proxy advisors, is that a company can achieve the three basic objectives if has a high percent of pay at risk and maintains target pay at the median of its peer companies. The high percent of pay at risk ensures a strong incentive, the target pay percentile retains key talent because the company doesn’t allow target pay to fall below the median and the target pay percentile limits shareholder cost because the company doesn’t allow target pay to rise above the median.
In this paper, I will show that percent of pay at risk is a poor measure of incentive strength and that the target pay percentile is a poor measure of retention risk and shareholder cost. I will also show that there are better measures of incentive strength and of retention risk/compensation cost, and that these better measures have statistically and economically significant effects on future stock returns. Boards, compensation consultants, proxy advisors and institutional investors can use our future return models to assess the cost-efficiency of current and proposed executive pay plans. Active investors can use our pay dimensions to enhance their stock selection models. Hedge funds can use our models to create profitable long/short portfolios based on pay dimensions.
The conventional wisdom about executive pay design
ConocoPhillip’s 2025 proxy statement illustrates the conventional wisdom. ConocoPhillips says that “a company must offer competitive compensation to attract and retain experienced, talented and motivated employees” and “employees in leadership roles are motivated to perform at their highest levels when performance-based pay is a significant portion of their compensation”. ConocoPhillips notes that “target total compensation for each NEO is structured to target market competitive pay levels at approximately the 50th percentile” and highlights that “over 90 percent of the CEO’s 2024 target pay and over 80 percent of the other NEOs’ 2024 target pay was performance based.” The proxy advisor Institutional Shareholder Services (ISS), like Conoco Phillips, prefers a high percent of pay at risk with target pay set at the peer company median regardless of past performance.
Public company pay practices over the past twenty years show an increasing embrace of the conventional wisdom. Percent of pay at risk for the median S&P 1500 CEO has increased from 74% in 2004 to 86% in 2024. (1) A 2024 paper found that the average deviation of CEO grant date pay from the median pay of similarly sized companies in the same industry has declined by 45 percent from 2007 to 2021. (2)
The negative consequences of target dollar pay
An important, but little recognized, weakness of the conventional wisdom is using target dollar pay without any adjustment for prior performance. This creates an inherent “performance penalty” in the determination of equity grant shares. An increase in the stock price is penalized with a reduction in grant shares, while a decline in the stock price is rewarded with an increase in grant shares. We can see this performance penalty in operation at ConocoPhillips. In 2021, when the stock price was $46.65, CEO Ryan Lance was granted 200,722 performance shares and 108,082 restricted shares. In 2024, when the stock price was $110.39, Lance was granted 90,781 performance shares and 48,883 restricted shares. In other words, while the stock price increased by 137%, Lance’s grant shares declined by 55%. The value of his equity grant in 2024 was only 7% higher than it was in 2021, and his proxy statement total compensation was 3% lower in 2024 than it was in 2021 ($23.9 million vs $23.1 million).
The performance penalty also works to increase grant shares for poor performance. In 2015, when the stock price was $29.06, Marathon Oil CEO Lee Tillman received 256,591 stock options, 135,487 performance shares and 81,292 restricted shares. In 2018, when the stock price was $14.52, Tillman received 298,914 stock options, 284,091 performance shares and 170,455 restricted shares. When we use the Black-Scholes model to convert Tillman’s stock options to an equivalent number of common shares, we find that Tillman’s equivalent common shares increased from 277,174 in 2015 to 574,564 in 2018, an increase of 107%. With the increase in grant shares, Tillman’s equity grant value in 2018 was 4% greater than it was in 2015 despite the 50% decline in the stock price. His proxy statement total compensation was 8% higher in 2018 than in 2015 ($12.2 million vs $11.3 million), despite a 50% decline in stock price.
Target dollar pay (unadjusted for prior performance) has three negative consequences. First, it weakens financial incentives for superior performance. Second, it undermines the alignment of cumulative pay and cumulative performance. Equity grant shares depend on the price path; cumulative performance with poor early performance pays much more than the same cumulative performance with good early performance. Third, it makes percent of pay at risk a poor proxy for incentive strength. With the same percent of pay at risk, an executive with bad early performance accumulates many more shares than an executive with good early performance. That makes the bad early performer’s pay much more sensitive to company performance; in other words, it gives the bad early performer a much stronger incentive even though the bad early performer has the same percent of pay at risk as the good early performer. Percent of pay at risk is a poor measure of incentive strength because executives can have very different incentives with the same percent of pay at risk. (3)
A better set of pay dimension measures
The pay measures used by the conventional wisdom – percent of pay at risk as a proxy for incentive strength and target pay percent from market – don’t provide good measures of a company’s success in achieving the three basic objectives of executive pay. Percent of pay at risk doesn’t provide a good measure of incentive strength because two executives with the same percent of pay at risk can have very different pay sensitivities to performance. Target pay percent from market doesn’t provide a good measure of retention risk or shareholder cost because it doesn’t adjust for performance. Target pay at market provides a very strong retention incentive for a 10th percentile performer but a very weak retention incentive for a 90th percentile performer. Target pay at market is high shareholder cost for a 10th percentile performer but low shareholder cost for a 90th percentile performer.
To improve on the conventional wisdom measures, we need to measure incentive strength, that is, pay sensitivity to relative performance, and we need to measure performance adjusted cost, that is, the pay premium at industry average performance. To do these two things in the most meaningful way we need to measure pay on a “mark to market” basis rather than rely on the grant date pay reported in the proxy’s Summary Compensation Table. We need mark to market pay because changes in mark to market pay capture the incentive provided by unvested equity compensation. Happily, U.S. companies are now required to make a “Pay versus Performance” (PvP) disclosure that includes a five year history of mark to market pay, called “Compensation Actually Paid” or “CAP”, for the CEO and for the average of the other Top 5 executives. (4)
The new CAP data shifts a huge data analysis burden from investors to companies but, unfortunately, it doesn’t currently provide the long history needed to assess the impact of pay dimensions on future stock returns. We can’t use the new PvP disclosures to estimate the impact of pay dimensions on future stock performance because we don’t yet have any five year PvP disclosures followed by a multi-year return period. Fortunately, we have an alternative although it requires extensive programming and data analysis. We can use historical grant data to estimate mark to market pay for a long history period, then estimate historical pay dimensions from that estimated mark to market pay and finally, relate those historical pay dimensions to future period stock returns. With Standard & Poor’s Execucomp database, we can estimate mark to market pay for 1992-2024, use that data to calculate pay dimensions for rolling five year periods and then assess the impact of those pay dimensions on future returns. Companies and investors should feel comfortable in applying our model of pay dimensions and future returns to the new PvP disclosures because we show, in the Appendix, that our mark to market pay estimates for 2020-2024 are similar to the mark to market pay values reported in the new PvP disclosures.
Estimated mark to market pay
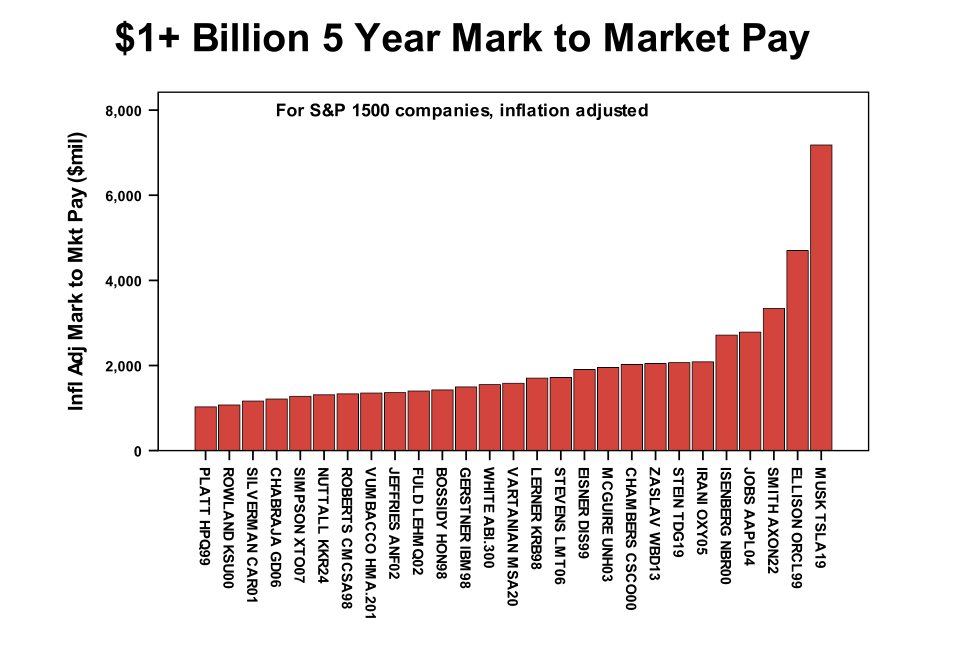
We have estimated mark to market pay for executives reported in Execucomp for the years 1992-2024. Figure 1 shows 27 CEOs with five year mark to market pay exceeding $1 billion, inflation adjusted to 2024. This group includes many very noted executives, including Larry Bossidy of Honeywell, John Chambers of Cisco, Michael Eisner of Disney, Lou Gerstner of IBM, Steve Jobs of Apple, William McGuire of United Health Group, and Elon Musk of Tesla. 15 of these 27 executives earned their $1 billion in a five year period ending in 1998-2002. Only 12 of them have earned $1 billion in a five year period ending after 2002.
The vast majority of these $1+ billion gains from stock gains. For example, 91% of Lou Gerstner’s $1.5 billion in inflation adjusted gains came from stock options.
How we measure pay dimensions
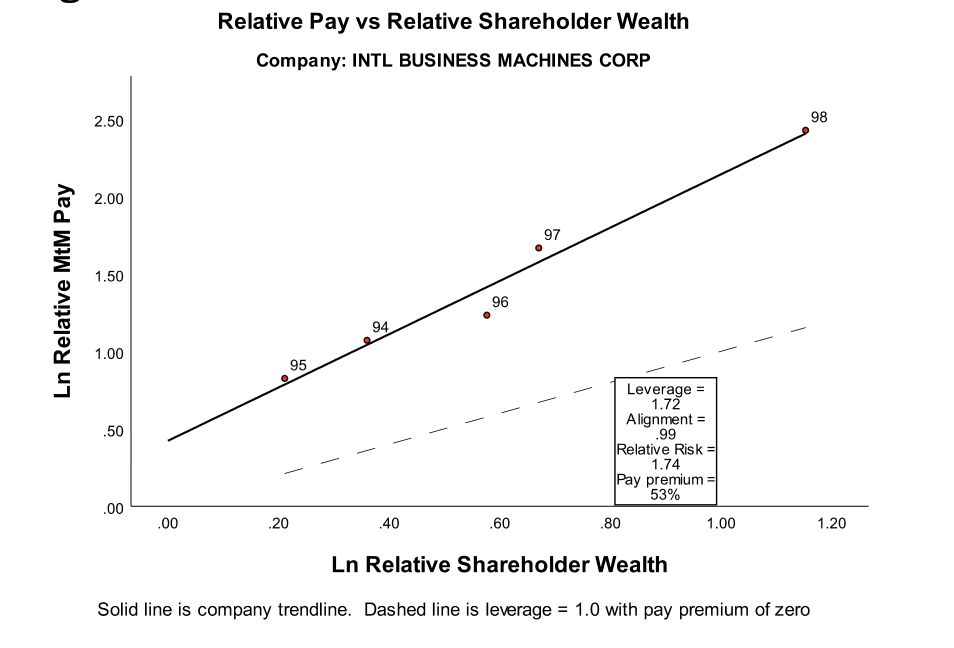
To measure the pay dimensions associated with these gains, we plot the natural log of relative mark to market pay against the natural log of (1 + relative TSR) and calculate the trendline. Figure 2 shows the scatterplot for 1994-1998 for IBM CEO Lou Gerstner. The vertical axis is the natural log of relative mark to market pay and the horizontal axis is the natural log of relative shareholder wealth. We use logarithms because they capture the assumption that a 1% change in relative shareholder wealth results in a constant percentage change in relative mark to market pay. (5) Mark to market pay is calculated on a cumulative basis over the five year measurement period. Relative mark to market pay is mark to market pay divided by cumulative market pay. Market pay is average pay for the same position in companies of equal revenue in the same industry. Our methodology for estimating market pay is explained in the Appendix. We estimate market pay for the first year of the five year period and adjust it for subsequent executive pay inflation but not for subsequent revenue growth. We don’t adjust for subsequent revenue growth because doing so obscures pay sensitivity to performance since shareholder return is often correlated with revenue growth. All figures are adjusted for inflation to 2024.
Inflation adjusted 1994 market pay for Gerstner is $20.7 million. It’s based on pay for CEOs in Technology Hardware (GICS 452020) adjusted to IBM’s inflation adjusted sales of $135 billion. Relative mark to market pay is intended to be a measure of pay relative to opportunity cost. To better match opportunity cost with utilization of resources (i.e., grant date pay), we match market pay to reflect the timing of Gerstner’s grant date pay. Since Gerstner had a large equity grant in 1997, we allocate 56% of Gerstner’s market pay to 1997 (without changing the five year present value of market pay).
How we measure expected shareholder wealth
Relative shareholder wealth is actual shareholder wealth divided by expected shareholder wealth. We calculate relative shareholder wealth for IBM for each of the five years 1994-1998 but we’ll illustrate the calculation just using the full five year period. IBM had a huge five year return, increasing shareholder wealth, with dividends re-invested, by 665%. To compute IBM’s relative shareholder wealth, we need to divide IBM’s actual shareholder wealth by its expected shareholder wealth. Expected shareholder wealth is beginning shareholder wealth increased by IBM’s expected return, taking account of risk and taking account of actual market and industry returns. IBM’s cost of equity, 10.8% based on a four factor Fama-French model, provides the adjustment for risk, a five year expected return of +67% (= 1.108^5 – 1). This brings expected fifth year shareholder wealth up to 167% of beginning shareholder wealth but we still need to adjust for market and industry performance. We use market and industry betas for IBM, together with market and industry excess returns, to adjust for market and industry performance. The five year market excess return is 42.5% and IBM’s beta to the market excess return is 0.47, so the market excess return adds 20.0% (= 42.5% x 0.47) to IBM’s expected shareholder wealth. The five year industry excess return is 47.3% and IBM’s beta to the industry excess return is 0.55, so the industry excess return adds 26.0% to IBM’s expected shareholder wealth. The total contribution of market and industry performance is 46.0% and when we add that (geometrically) to the 67% risk adjustment, we get a total expected return of 144% (= (1 + 67%) x (1 + 46%) – 1). This means that expected shareholder wealth is 244% of beginning shareholder wealth and IBM’s five year excess return is (765%/244%) -1 = 217%.
Once we have calculated relative pay and relative performance for each year, we can calculate the trendline relating log relative pay to log relative TSR. As shown in Figure 2, the trendline slope, what we call pay leverage, is 1.72 for Gerstner. This means that a 1% increase in relative shareholder wealth is associated with a 1.72% increase in relative pay. This is a quite strong incentive. Figures 3 and 4 show that it’s above the 75th percentile compared to S&P 1500 CEOs for the years 1998-2024 (1.33) and against the CEOs reported in the 2020-2024 PvP disclosures (1.03).