Here, we speak to Professor Georgiy L. Stenchikov at the Physical Science and Engineering Division, King Abdullah University of Science and Technology about the modelling that shapes regional climate change interventions and their research surrounding the future of water
His work looks at one of the key issues of the era, the future of water – especially when it comes to rapidly heating climates in the Middle East. While water is critical to the survival of humankind, it is also being lost to the changing conditions of climate.
But humans are not helpless, especially when it comes to the application of scientific intervention. In his landmark paper on Sea Breeze Geoengineering [link to paper here], Professor Stenchikov proposes a way to change the fate of the region – with particular focus on how precipitation can be manipulated for the greater good of the climate.
First, what are you working on?
“A significant portion of my research is focused on regional climate change in the Middle East. It is not only the documentation of ongoing warming and predicting future changes, but uncovering the hidden physical mechanisms and climate feedbacks that govern the regional climate and its variability in this region. So, we not only quantify the regional warming, but explain its physical mechanisms. The process-based approach allows people to more reliably predict future changes, compensating for model deficiencies. The results of this research may have multiple implications, for examples, as we study the regional climate system we can evaluate renewable energy resources and their future impacts. But the most important thing is that this research helps us to understand how to adjust to the warming in the Middle East, where the pace of change is much faster than the average across the globe. Thus, the Middle East is at the forefront of global warming, providing a testbed for developing and testing the adaptation measures.”
“Our goal is to establish the region-specific modeling technology, to assist in decision-making and planning of adaptation measures. Global warming is on the way and we have to be prepared to counteract and mitigate its impact.”
What modelling tools do you use to help decision-making about precipitation and the safeguarding the future of water?
“The regional climate is driven by global and regional processes. Therefore, we use a combination of global and regional tools. We have a unique global high-resolution atmospheric model (HiRAM) that runs with 25 km grid spacing. This is comparable with the resolution for regional models. To study the fine-scale processes in desert regions, we use a Weather Research and Forecasting model coupled with the aerosol and chemistry module (WRF-Chem) – as it accounts for the important effect of dust in the Middle East. We also developed a coupled regional ocean atmosphere model, where we calculate the Red Sea circulation with 2-km spatial resolution.”
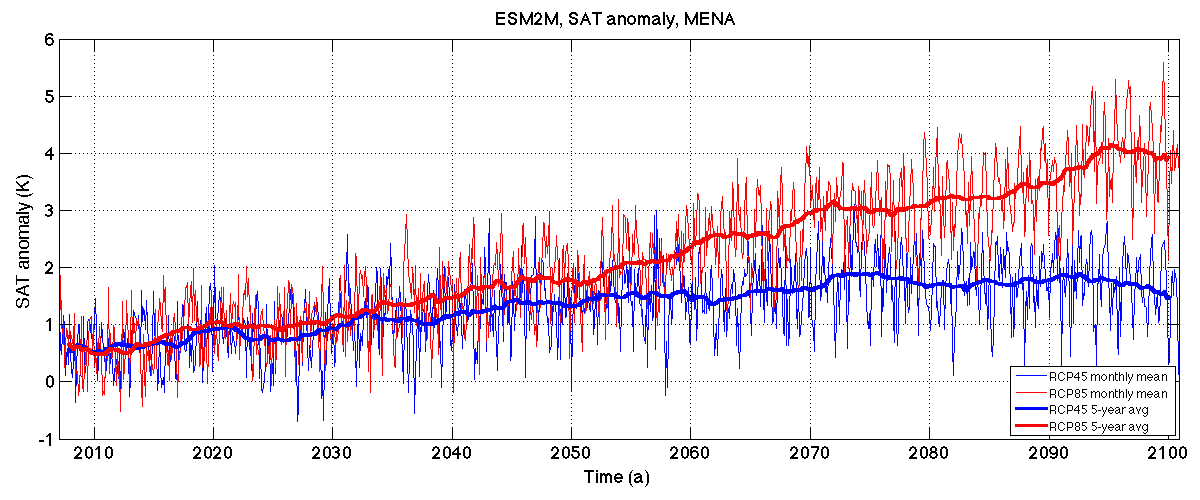
“Figure 1 shows our own predictions of climate change over Middle East and North Africa (MENA) with our 25 km resolution global HiRAM, for two scenarios. The blue curve corresponds to RCP 4.5 scenario, which assumes there will be a decreasing of greenhouse gases emissions. The red curve corresponds to RCP8.5 scenario, which is a business-as-usual scenario, without decrease of greenhouse gas emissions. We see that by the middle of the 21st century the MENA region could warm by more than 1.5 K.
Why do you think Middle East is more sensitive to global warming than other places?
Figure 2 shows the warming calculated by the best IPCC CMIP5 models for historic period and for different periods in the 21st century.
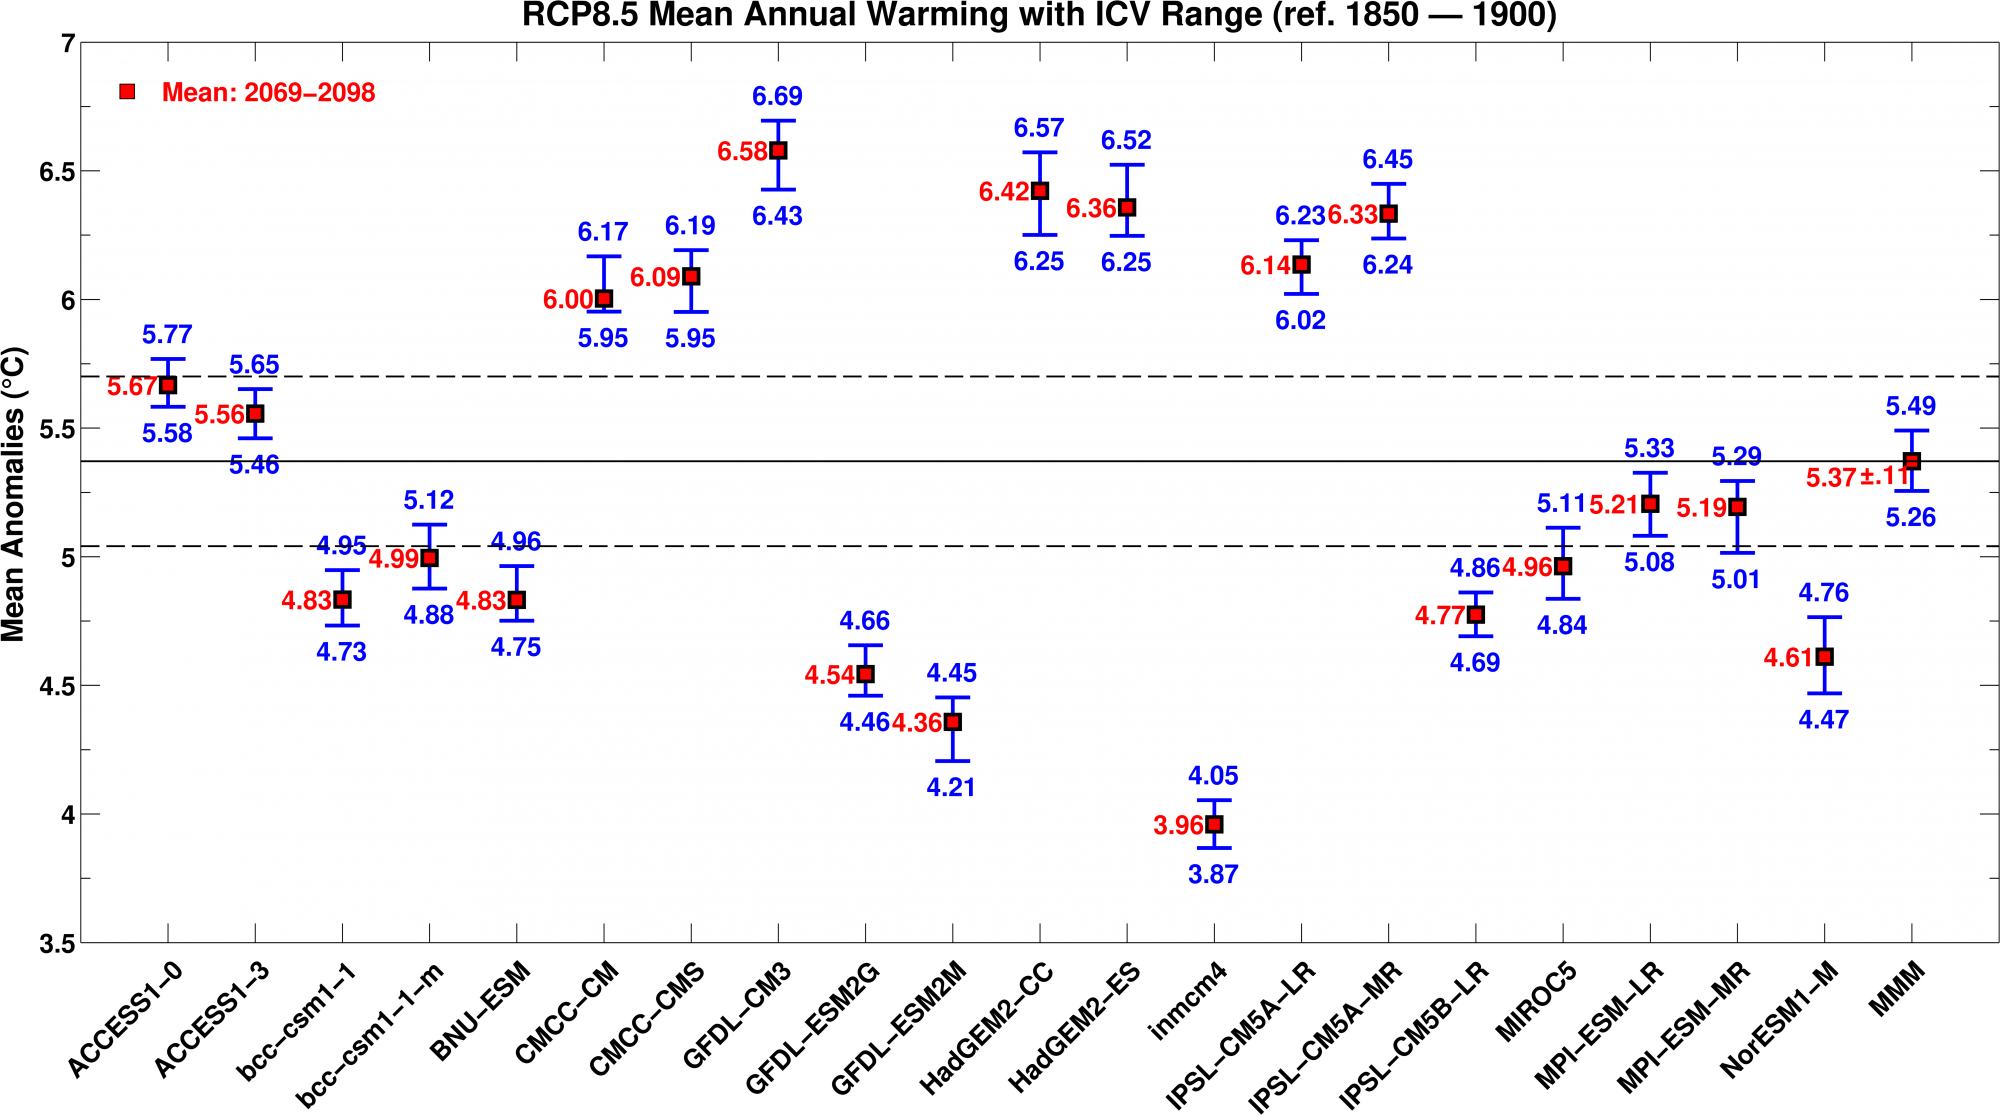
“In Figure 2, the green squares show temperature change with respect to preindustrial levels for the historic period. The models are pretty much consistent for this period. But the predictions of the individual models for the end of the 21st century (red squares) are quite different to one another, because the models have different climate sensitivity. Therefore, we averaged the model predictions, combining them in the so-called multi-model ensemble.
“The results of the multi-model ensemble are shown in Figure 3, which illustrates the higher climate sensitivity in the Middle East compared with the globe.
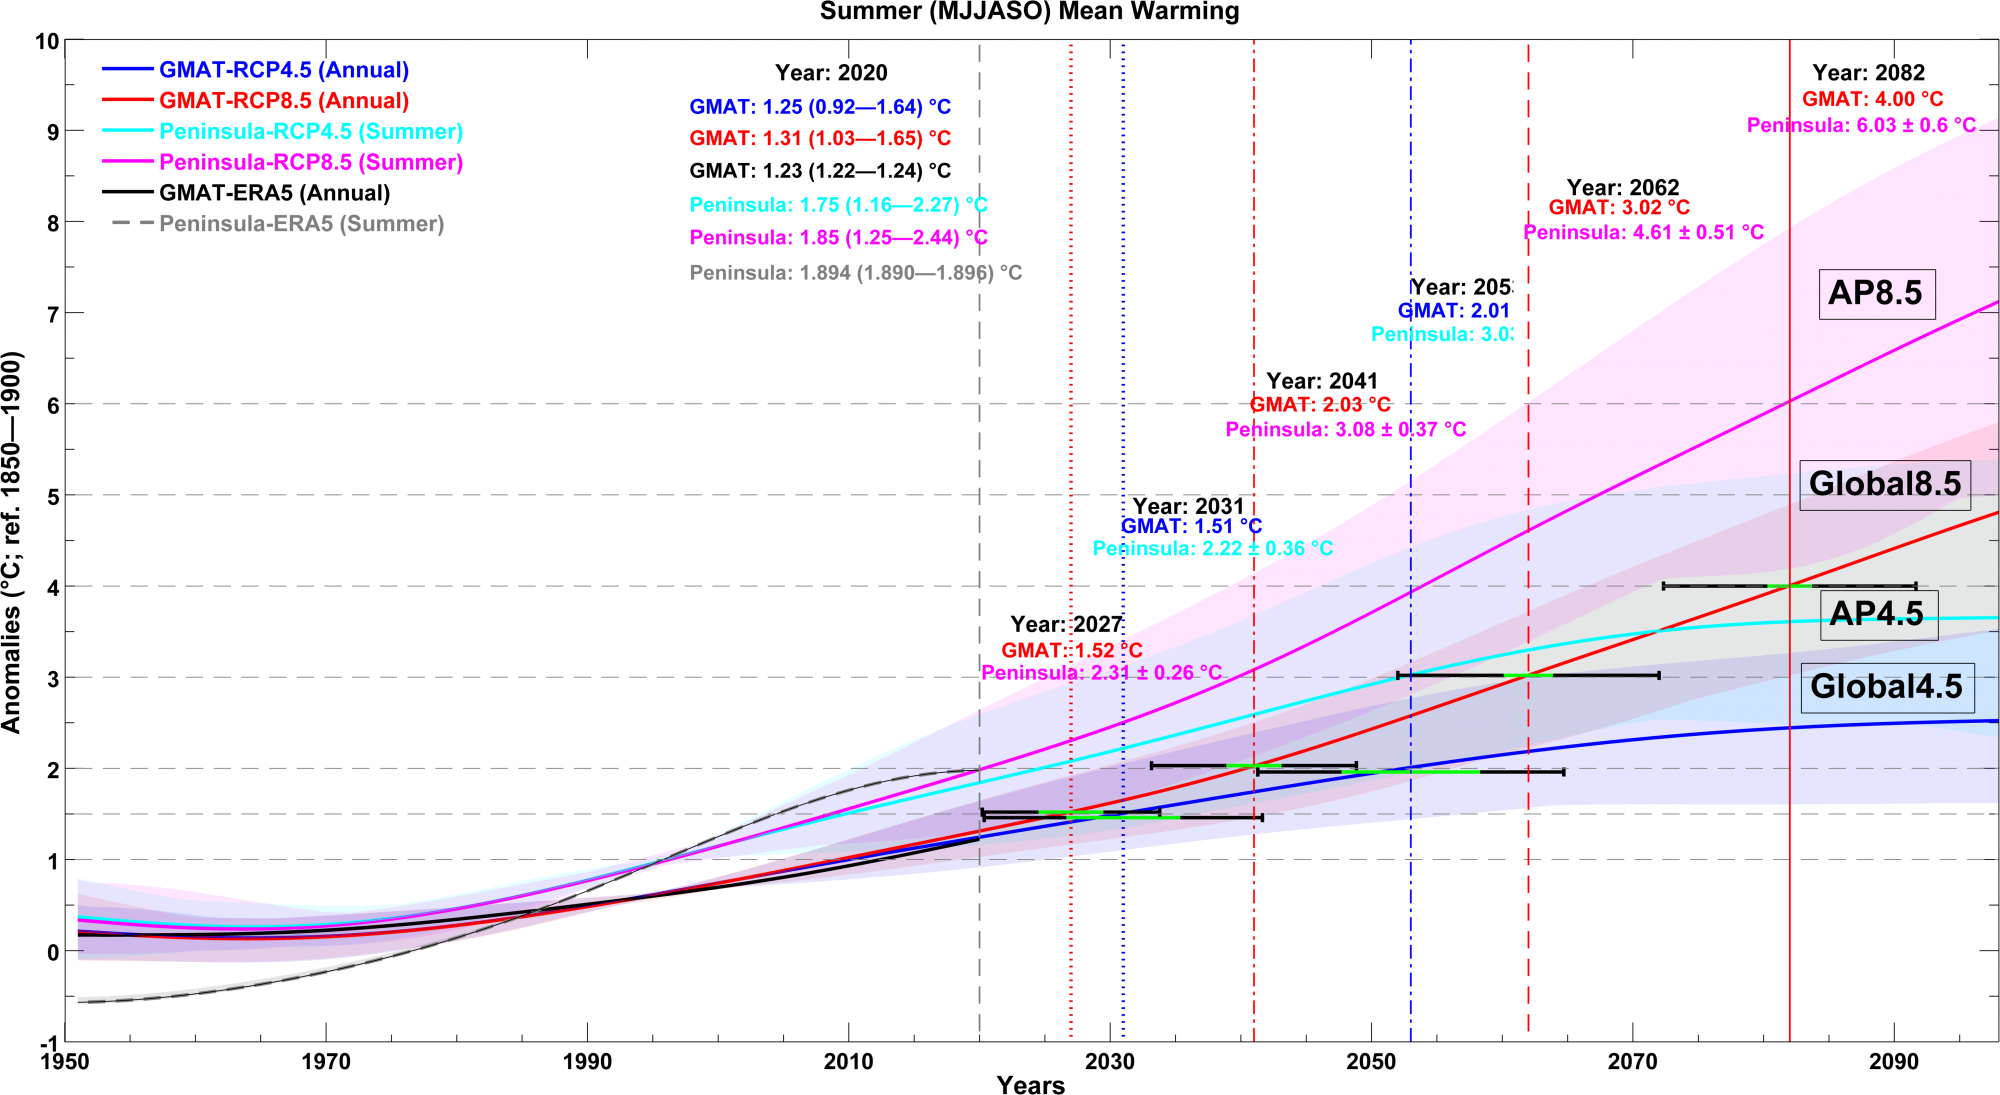
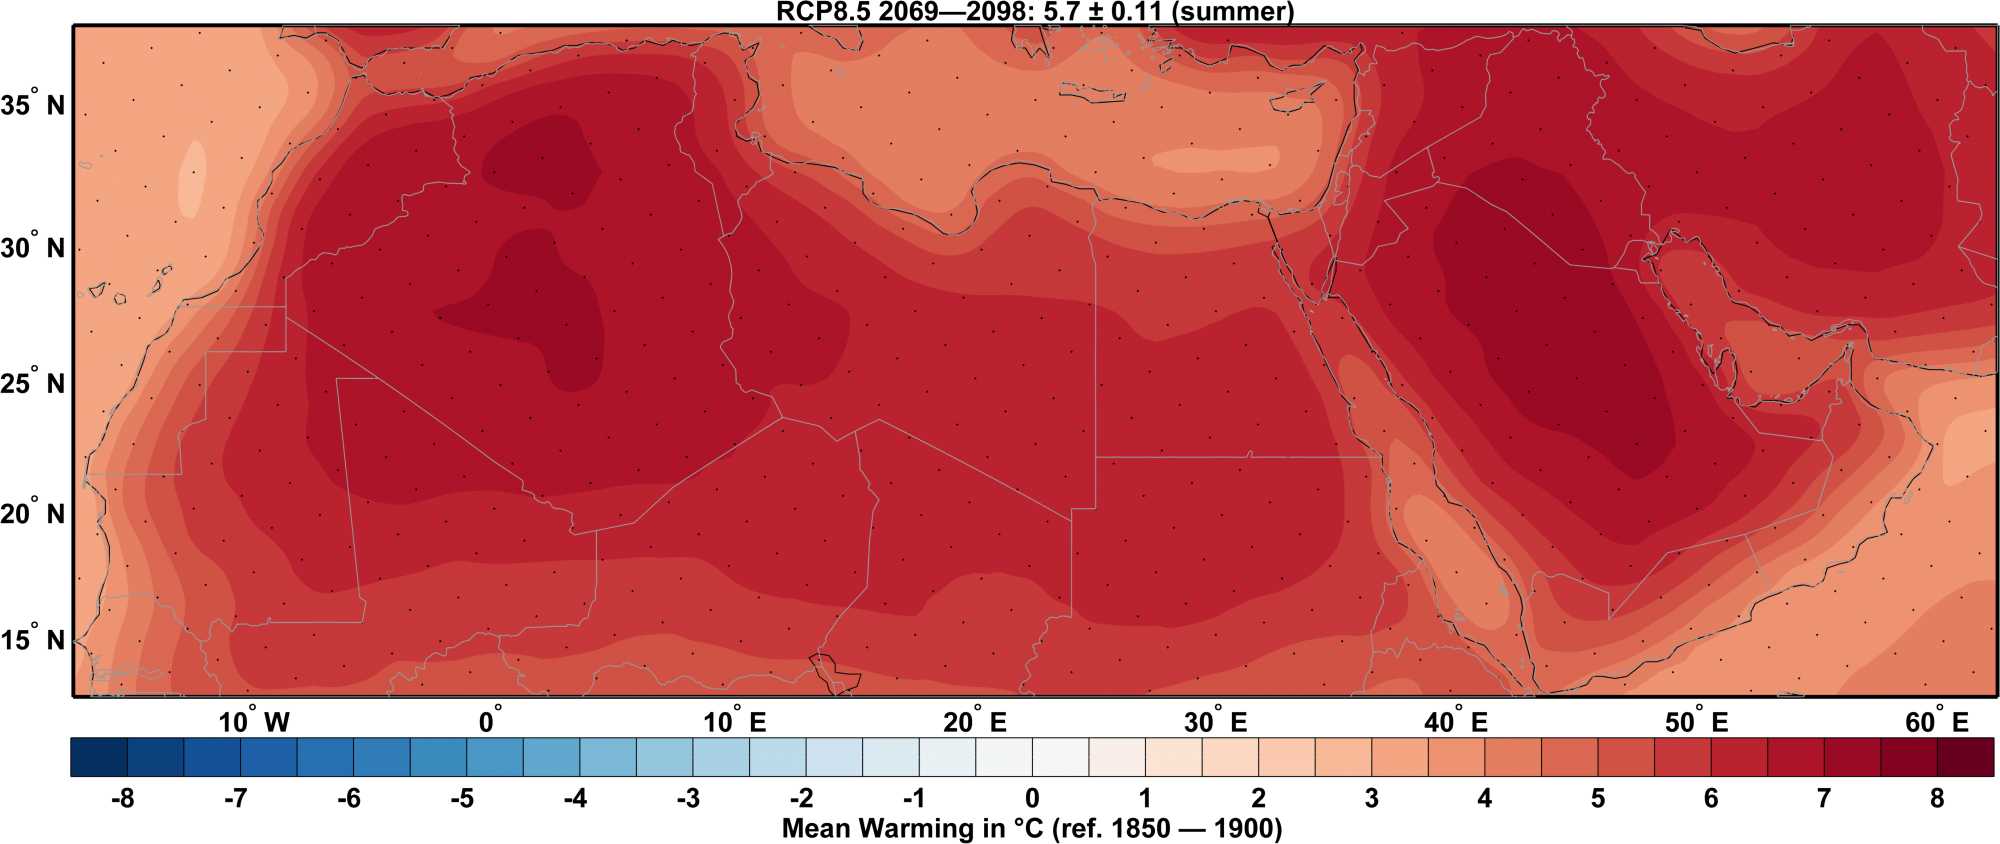
“There are a few reasons why desert regions, and in particular the Middle East, are warming faster than the rest of the world. And why summer, the hot season in this region, is warming faster than winter. For example, the extreme dryness in a desert causes the land temperature to respond more vigorously to a radiative forcing than in mid-latitudes, where the temperature response is mitigated by increase of evaporation. Figure 3 shows temperature change over the globe and over the Arabian Peninsula with respect to preindustrial temperature of 1850-1900 for two scenarios: RCP8.5 and RCP4.5. Let’s focus on the more dangerous RCP8.5 scenario. The red “global8.5” curve is below the Arabian Peninsula (AP8.5) curve by more than 2K by the end of the 21st century. Thus, the pace of global warming in the Middle East is at least 30% faster than the average across the globe.
“The temperature change that we see before 1970 is mostly caused by natural variability. In the 1970s, global warming took over. Of course, natural variability continues contributing to the temperature trend, but forced global warming signal prevails. However, because natural variability is pretty strong, it’s more difficult to predict climate in this region than in other regions.
“Middle Eastern warming is not spatially uniform. It is more intensive in the centre of the Arabian Peninsula, but the coastal areas are less affected. This is because of the influence of the regional seas that warm slower than land. These coastal areas that have access to desalinated water will probably attract a lot of population migration, from the interior of the Arabian Peninsula when temperatures in the interior regions became unbearable.”
What unique factors do you consider when working in the Middle Eastern climate?
“The Arabian Peninsula and the Middle East are in the centre of the Earth’s dust belt. Therefore, dust produces a very strong effect on the radiative budget in this region, much stronger than the greenhouse gases. For example, over the southern Red Sea in summer, dust causes the strongest in the world solar radiative cooling that reaches 60 W/m2. In our work, we account for the dust effects interactively, i.e., we calculate dust generation, transport, and radiative feedback simultaneously.
“The dust effect over the Arabian Peninsula is getting stronger during the recent decade or so. In Figure 5 you see the strong positive trend of dust optical depth, which is the factor we use to calculate its radiative impact. This trend shows that the effect of dust increased over Arabian Peninsula, from 2000-2015. And the large portions of the Red Sea and Arabian Gulf are affected, as well as the land areas.
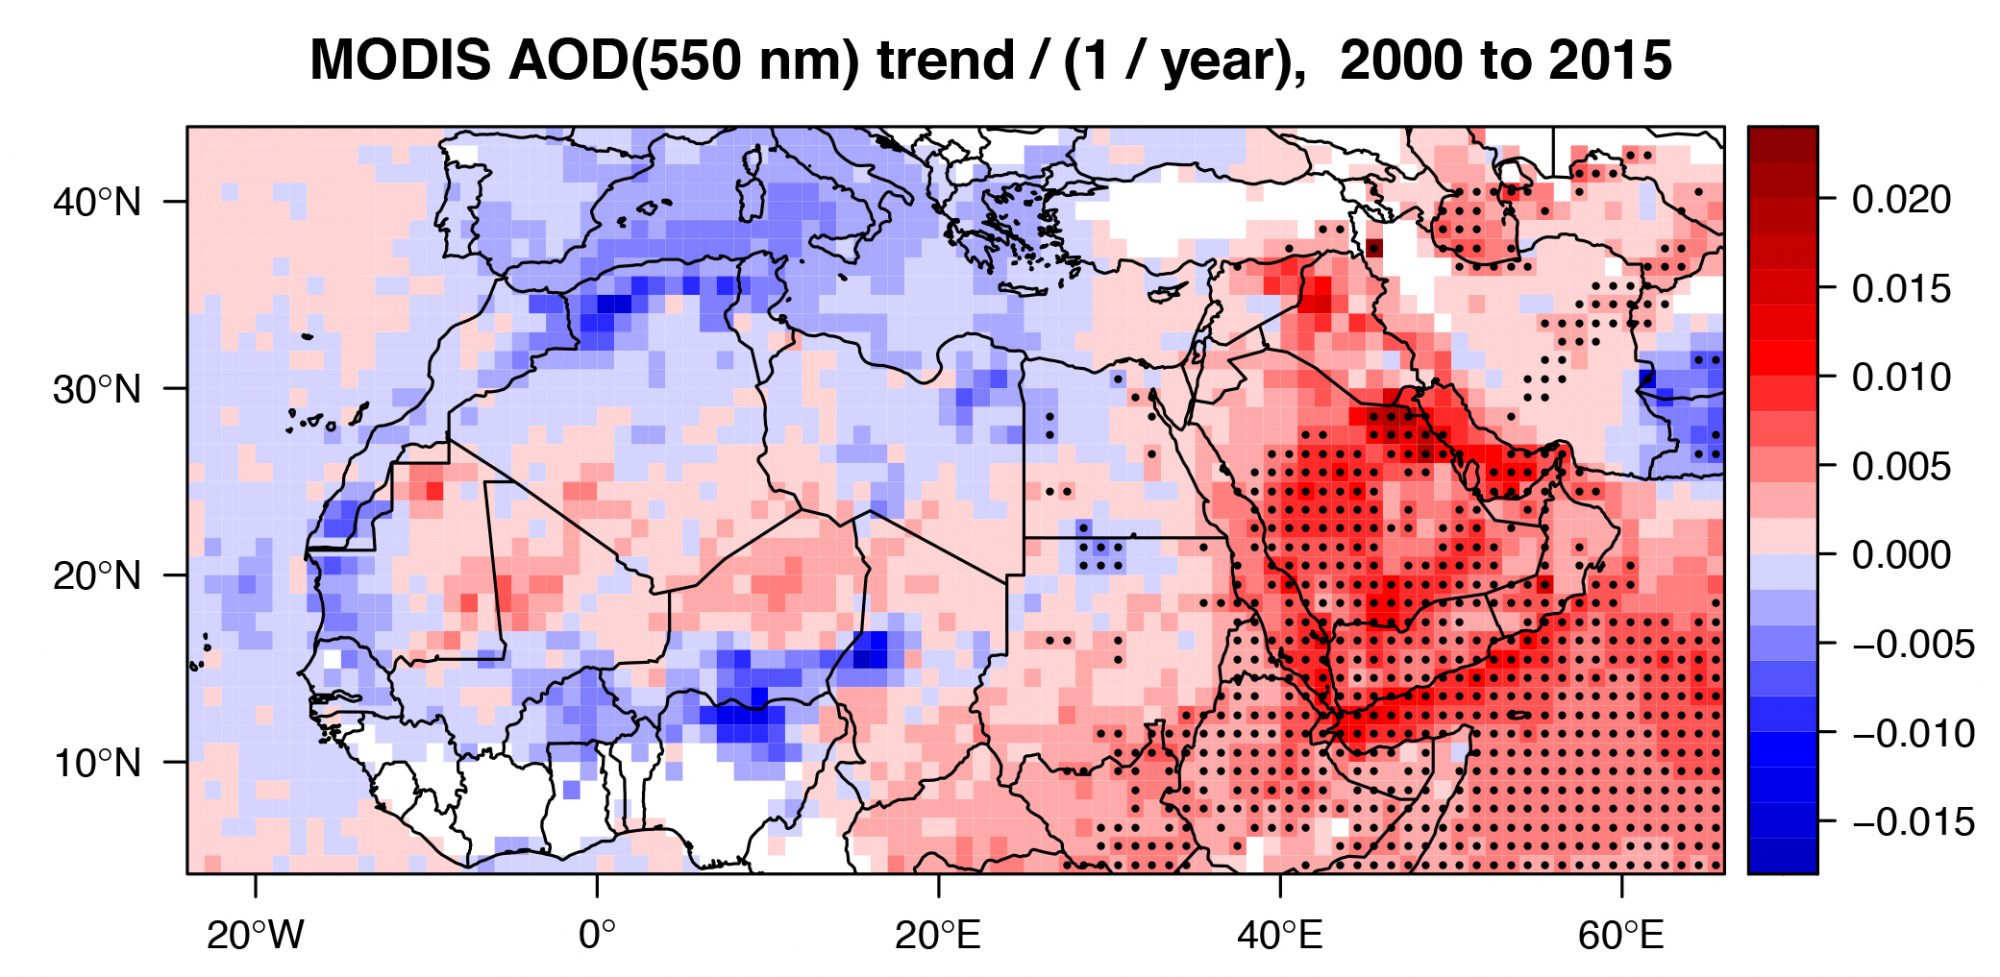
550nm AOD from MODIS Terra, collection 6. Pixels with significant trend (p value< 0.01) are marked with a dot. See (Klingmueller et al., 1016).
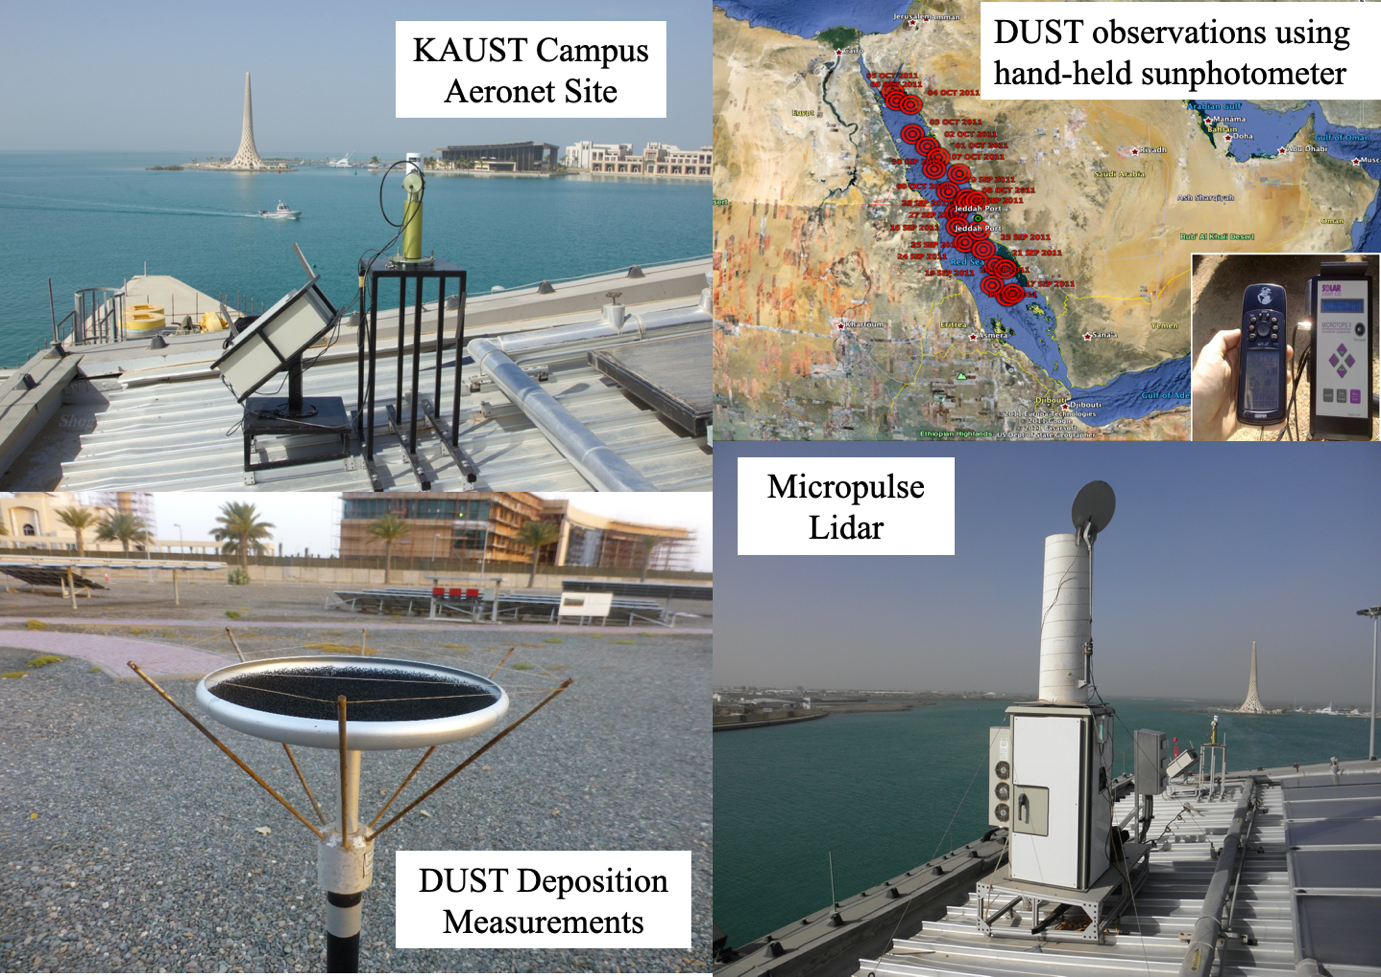
“Along with the modelling of mesoscale and haboob dust storms, my group conducts the state-of-the-art dust measurements (see Figure 6). We do it in cooperation with the NASA Goddard Space Flight Center. NASA regularly calibrates our instruments, and our multi-year observations are available on the NASA Goddard website.
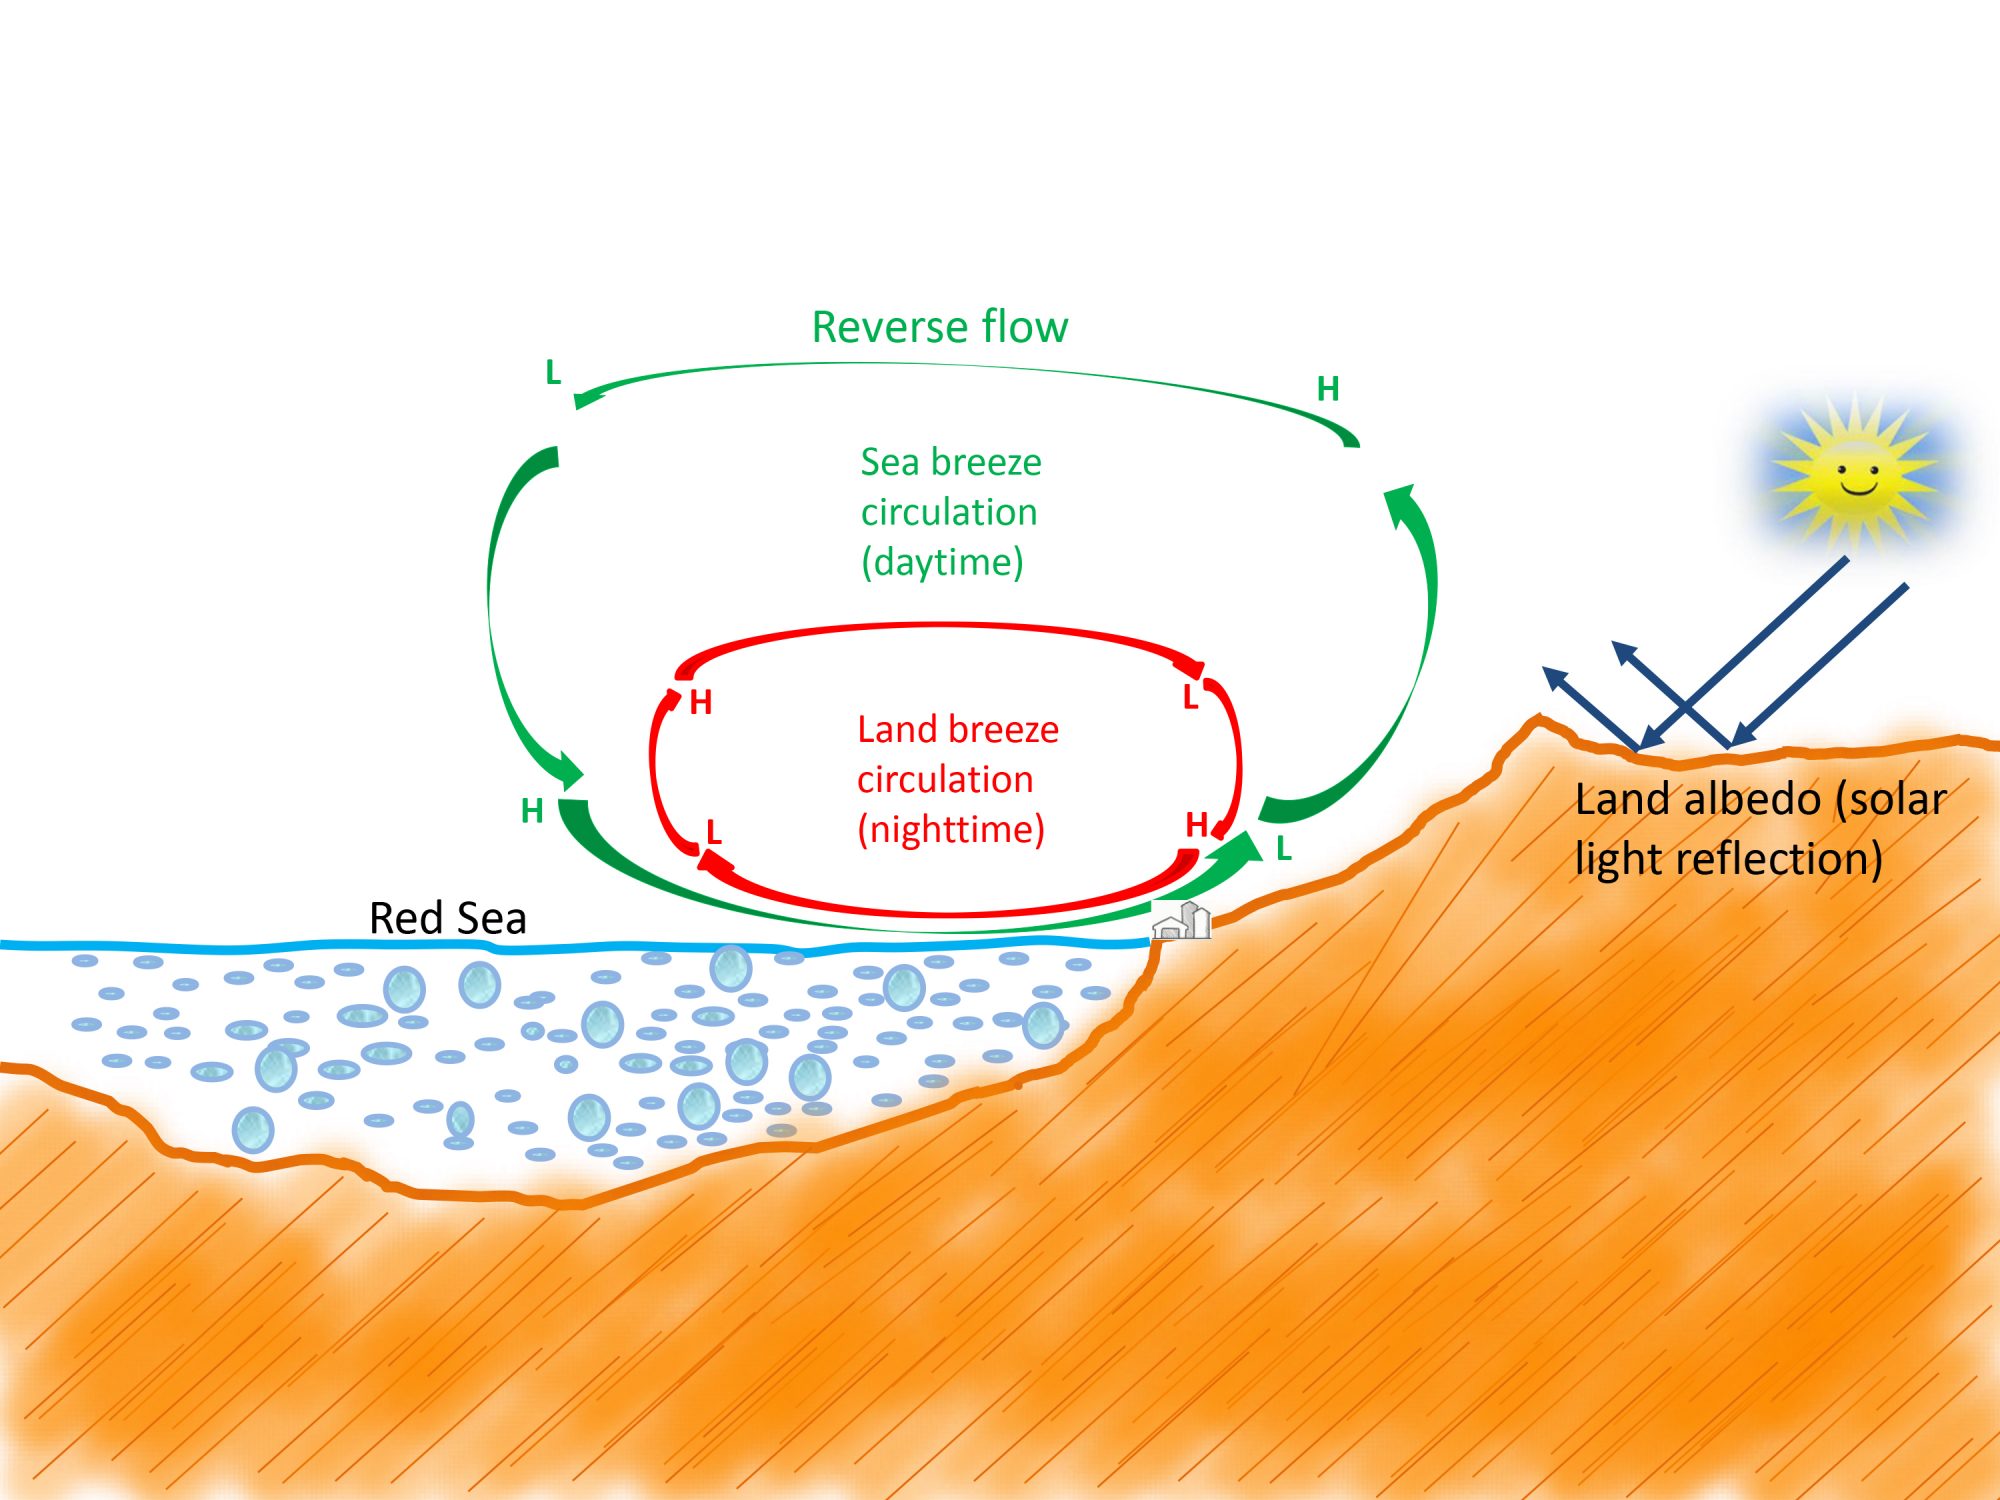
“As we mentioned, global warming in the Middle East is associated with the extreme dryness of the climate. However, the regional seas evaporate more than one teraton of water annually. For example, the Red Sea evaporates two meters of water per year. This huge amount of fresh water is transported by breezes inland, but most of it returns, so that almost all evaporated water is transported elsewhere and does not form precipitation over the coastal areas of the Red Sea (see Figure 7). This is different at the southern Red Sea, where higher than in the central and northern Arabian coastal Plain, mountain ranges create regular orographic precipitation.
Climate Change Interventions: How can you increase precipitation, based on your experiments so far?
“Figure 7 shows breeze circulation. The air from sea moves to about 200 km inland, but it returns back. Breezes transport a huge amount of fresh water. The idea is, to use this naturally circulating water in a 200 km belt. It is especially important because in future the coastal plain will be the mostly populated area, as its pace of warming is lower than in the central Arabian Peninsula.
“We propose changing land surface properties to trigger precipitation. We know that higher mountains, like in the southern Red Sea coastal plain, would increase orographic precipitation in the northern and central Red Sea coastal areas. But building mountains is not really feasible. Therefore, we started by testing how changing the physical properties of the areas over the Red Sea Arabian coastal plain could affect precipitation. First, we thought about reforestation. Reforestation of large land areas in the Middle East and Saudi Arabia is in line with the Saudi Green Initiative that assumes planting 10 billion trees in Saudi Arabia.
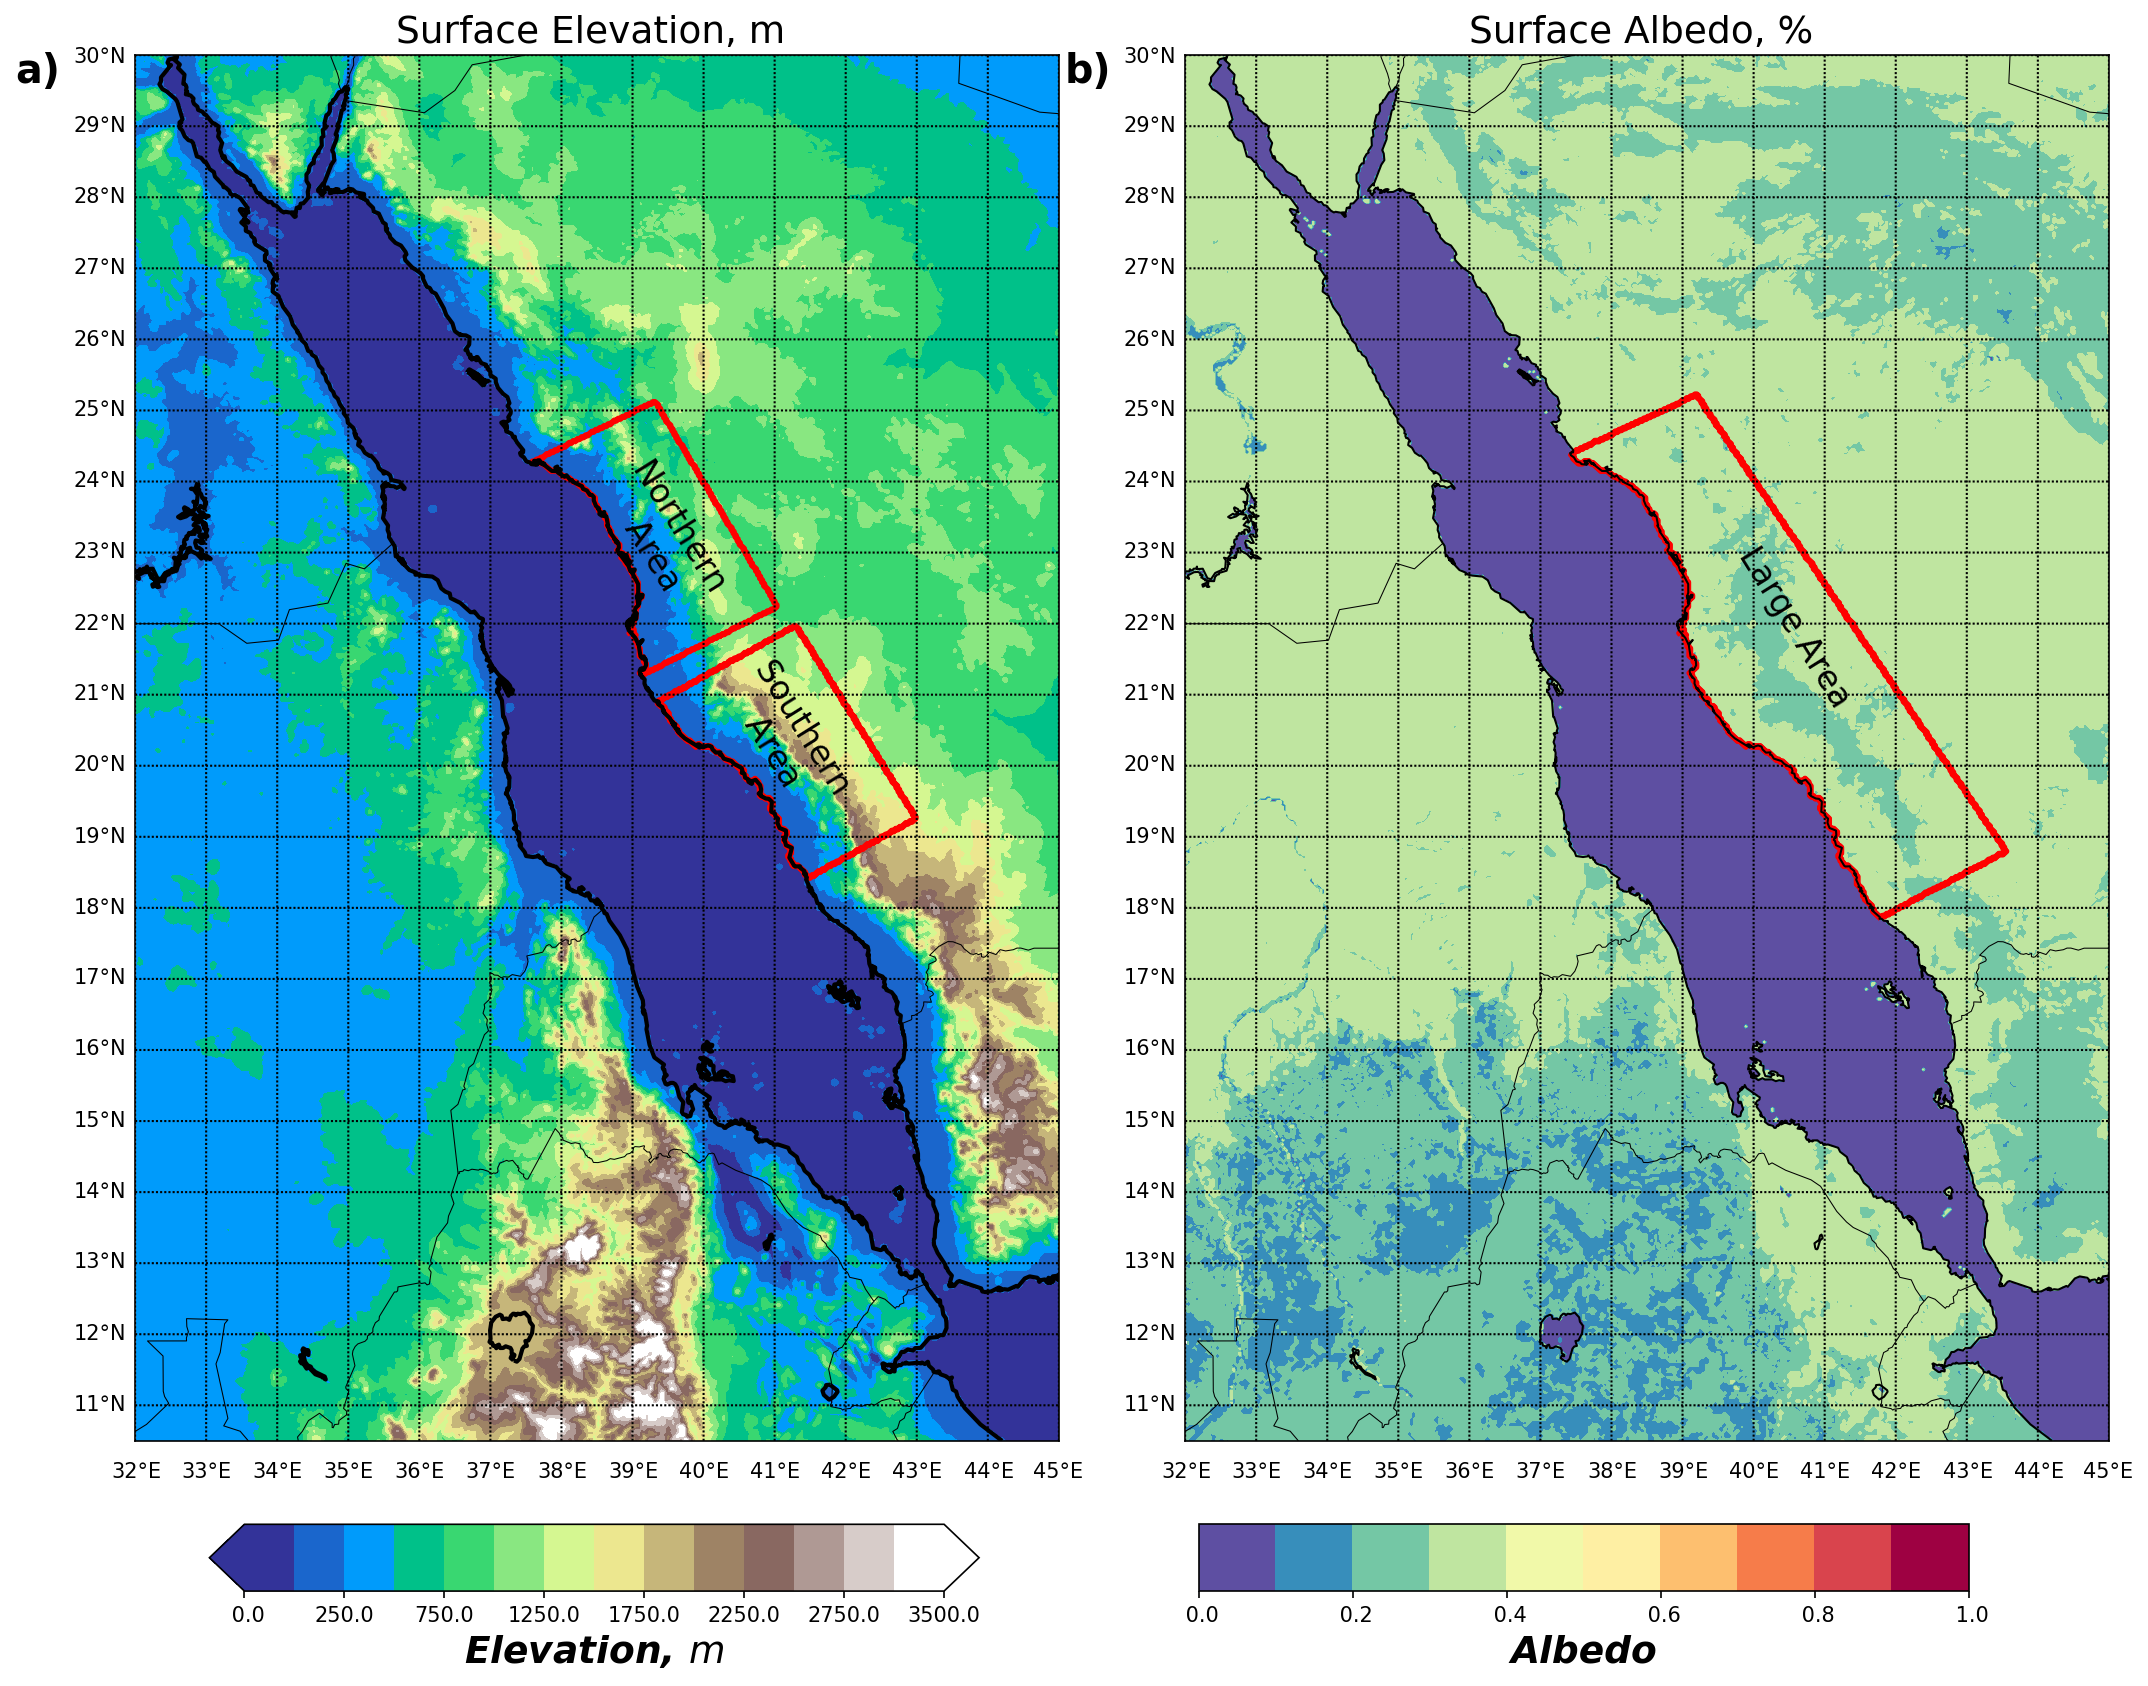
“To test this idea we chose the large area of 150,000 km2 along the Red Sea coastal plain, and two smaller areas, to understand how the precipitation would depend on the size and the position of the land modification areas (see Figure 5). “
“We assume that about 1 billion broad-leaf trees could be planted in the large area. This is 10% of what is supposed to be planted through the Saudi Green Initiative.
“The red sea evaporates about one thousand gigatons of water annually. Saudi Arabia consumes annually about 10-15 gigatons of fresh water. This is about 300 tones per capita, including personal, industrial, and agricultural use. This is the greatest per-capita water consumption in the world.
“Saudi Arabia is also the greatest producer of desalinated water (1 Gt annually), providing high quality drinking water to their population. But most of this fresh water goes to agriculture, with a significant portion of it coming from deep aquifers. This water is 9,000 years old. It cannot be replenished, so we lose it forever.”
Did precipitation increase when you put trees on the coastline?
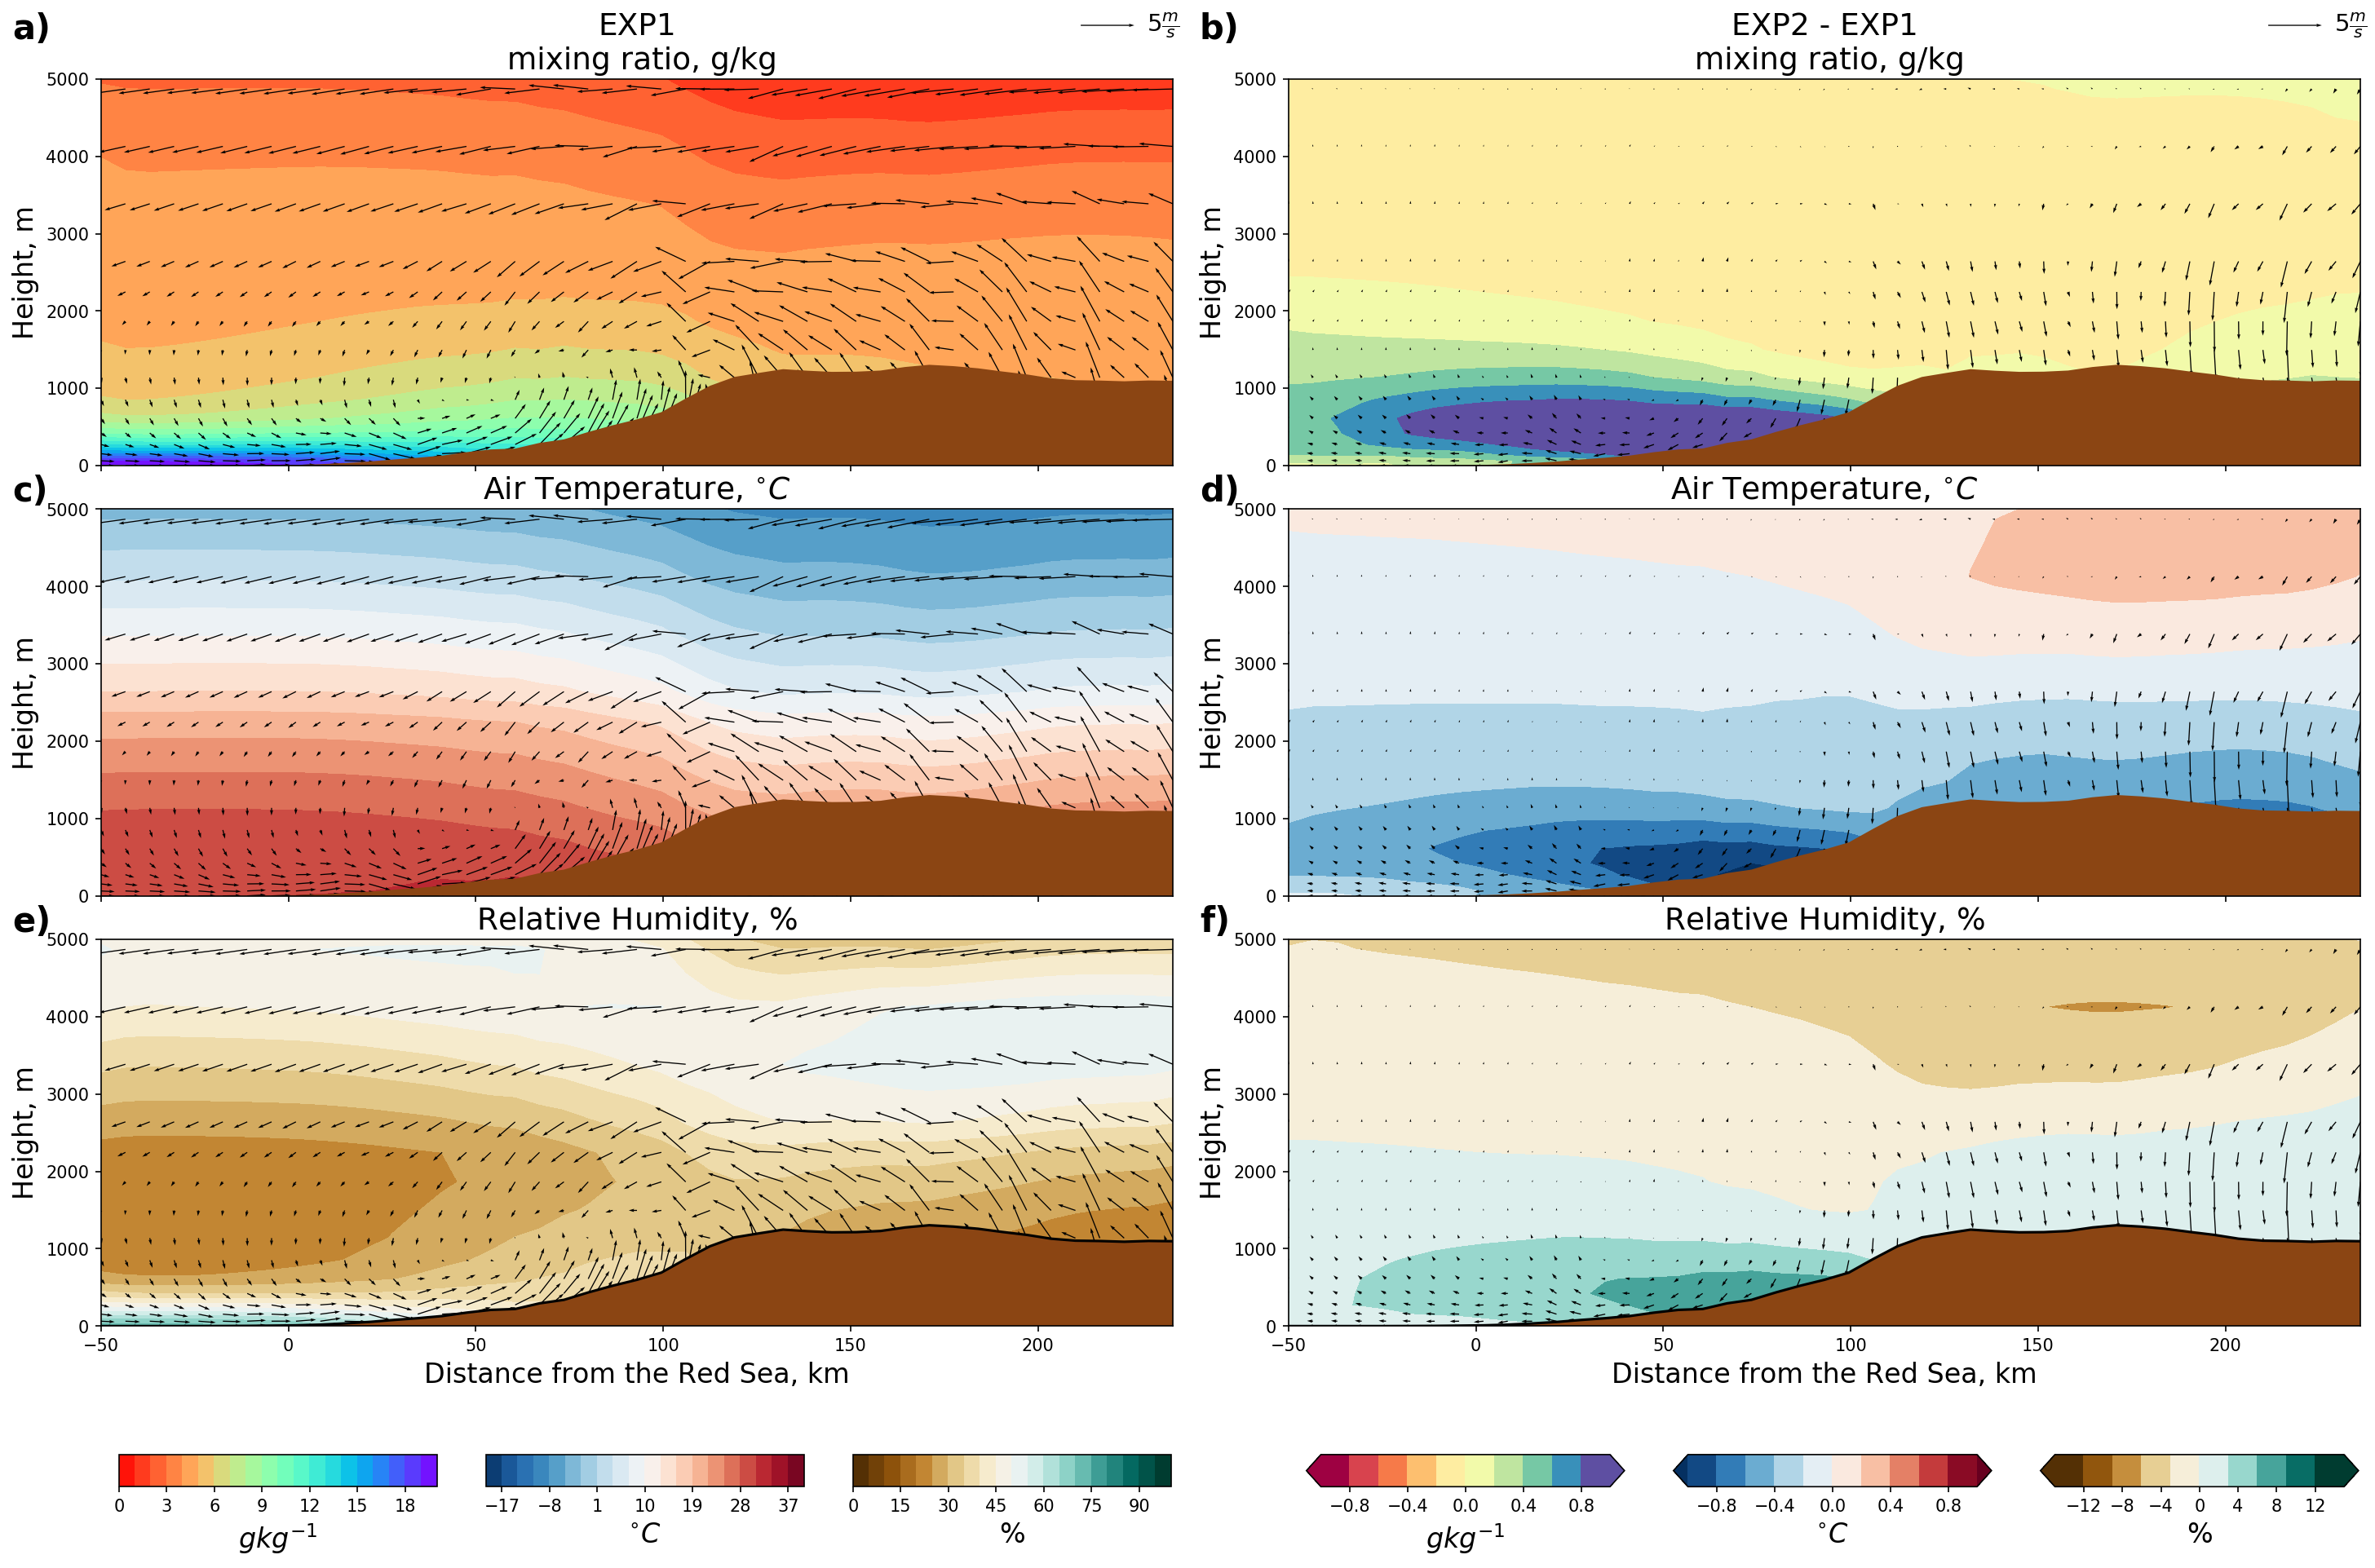
“We conducted a series of numerical experiments and found that coastal afforestation decreases precipitation. In addition, trees require watering, so as a result we lose almost 40 gigatons of water. That was a surprising result because everyone thought trees would increase precipitation. But this effect can be explained from a physics standpoint – the precipitation decreased because the coastal forest cooled the land and decreased the temperature contrast between land and sea that drives breezes. As a result, breezes weaken and the moisture flux from the sea to the land decreases, as does precipitation. Figure 6 shows that afforestation in EXP2 decreases breeze flow, temperature, and relative humidity compared to EXP1, without afforestation.”
How else can precipitation be increased?
“Another way to affect coastal precipitation is to change the land surface albedo. The land albedo regulates reflection of solar radiation from the land surface. If land albedo increases, more solar radiation is reflected, and land cools. If land albedo decreases, more solar radiation is absorbed, and land warms. Thus, the increase of albedo over the selected regions causes an effect similar to afforestation. The breezes weaken and precipitation decreases. But decrease of albedo warms the coastal plain, strengthens the breezes, and increases precipitation (see Figures 7).
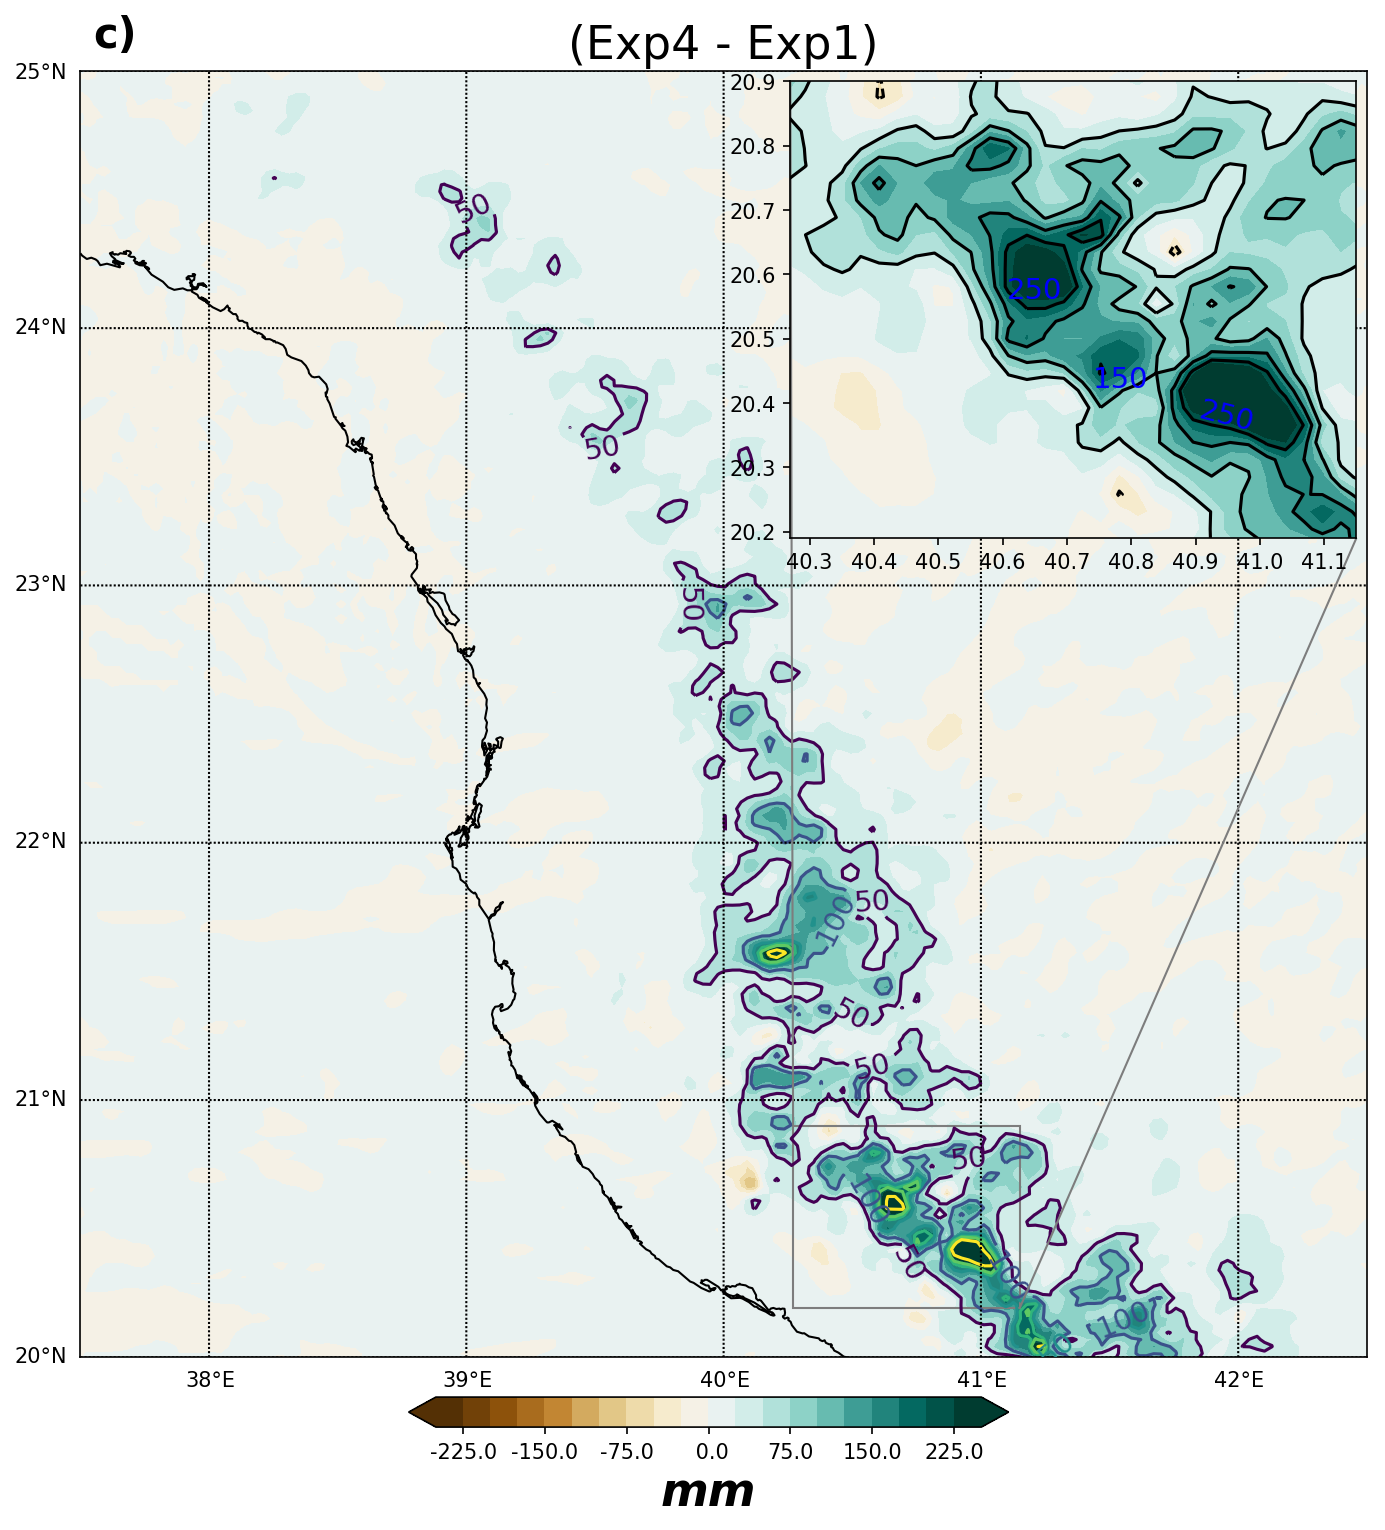
“Our idea was to change the albedo by distributing solar panels over the coastal plain. The solar panels effectively have an albedo of 20%, which is twice as small in comparison to the desert albedo.
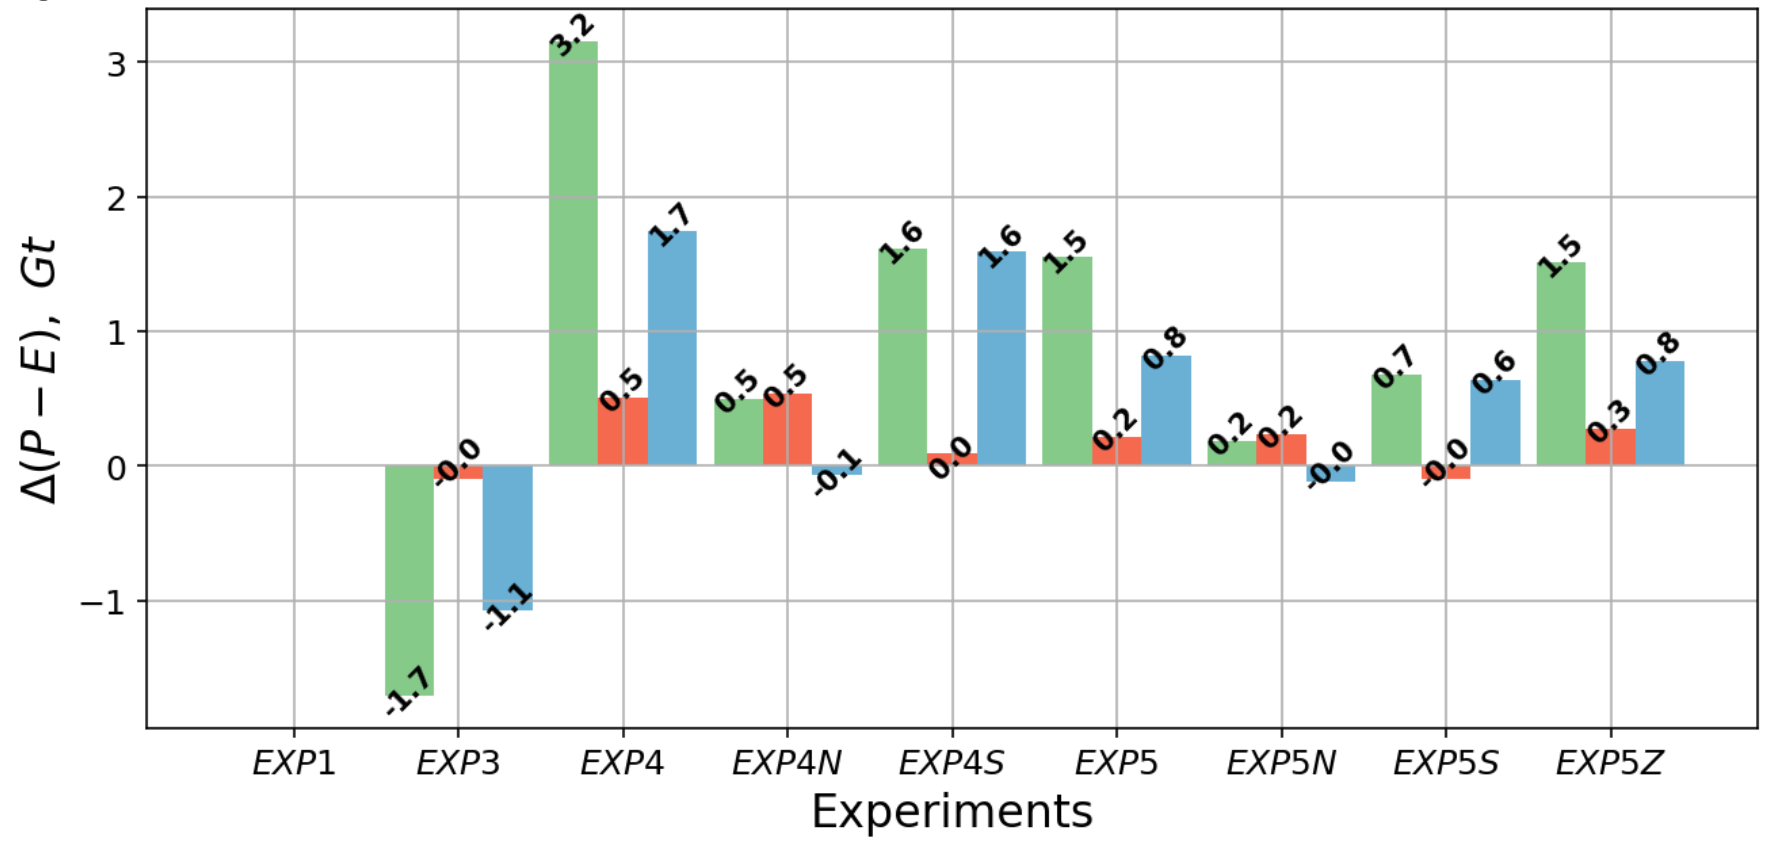
“According to our modelling results, these breeze geoengineering gives additionally 2-3 gigatons of water per summer period. Increase of precipitation is stronger in the areas where precipitation is stronger, i.e., in the South, while it is less in the North. However, solar panels will produce electricity that could be used for sea water desalination. The negative effect is that coastal areas will warm by about 1.5°C, as a result of decreasing of the surface albedo.”
Thus breeze geoengineering over the Red Sea Arabian coastal plain might be considered as a feasible adaptation measure, that could mitigate the current and future water crises in this area.
References
- Klingmüller, K., Pozzer, A., Metzger, S., Stenchikov, G. L., & Lelieveld, J. (2016). Aerosol optical depth trend over the Middle East. Atmospheric Chemistry and Physics, 16(8), 5063-5073. DOI: 10.5194/acp-16-5063-2016
- Mostamandi, S., Predybaylo E., Osipov S., Zolina O., Gulev S., Parajuli S., Stenchikov G. (2022). Sea Breeze’s Geoengineering to Increase Rainfall over the Arabian Red Sea, J. Hydrometeorology, 23(1), 3-24. DOI: 10.1175/jhm-d-20-0266.1, https://journals.ametsoc.org/view/journals/hydr/23/1/JHM-D-20-0266.1.xml