The nuclear architecture of the genome describes the structural order of the genetic information in our cells. It is like a house that protects the family in it, and each room in this house has a role to play, like the kitchen or the living room
In normal cells, the nuclear architecture is organized such that chromosomes and genes are found in specific locations in the nucleus of the cell. Similarly, one commonly expects to find the stove in the kitchen and the sofa in the living room.
In the architecture of the normal nucleus, chromosomes are not randomly positioned and not simply intermingling, but they occupy specific nuclear locations called chromosome territories. For example, a specific chromosome may be located at the nuclear periphery or in the nuclear interior. In normal cells, these positions are cell- type, cell-differentiation and cell cycle-dependent. Speaking of the house I mentioned above, each room houses specific furniture and items used in each of the rooms.
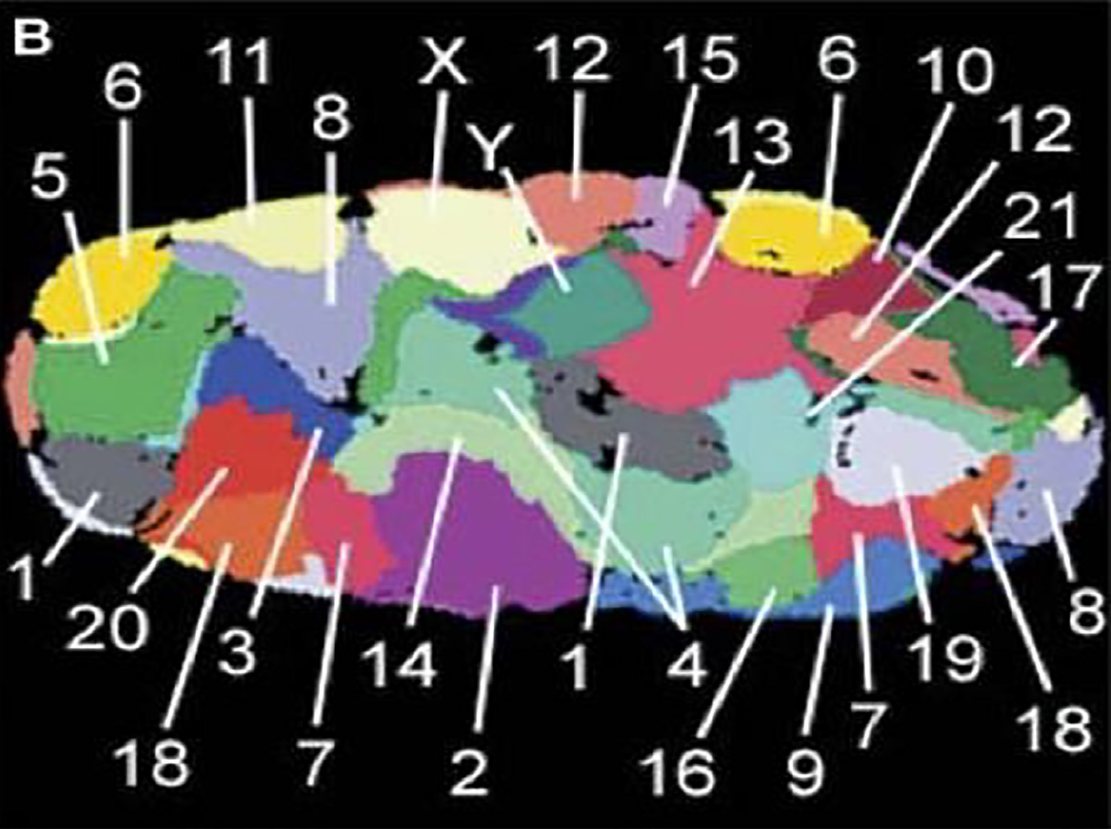
Figure 1 shows the normal organization of all chromosomes in a nucleus of a fibroblast (skin cell). Each chromosome is located in its specific chromosome territory.
In tumor cells, this order is different. It is not simply changed once, but it constantly changes. This continued genetic and architectural change in cancer cells is therefore called ‘dynamic.’ The dynamic nature of genetic remodelling is key to the genetic plasticity cancer cells exhibit and use to successfully outcompete their normal counterparts. Thinking about the house we used in the simplified analogy, if the contents of the rooms are changed continuously, the situation becomes quite disorganized. This chaos is typical of the tumor cells. They display genomic instability and continue to evolve so that the cancer cells can grow faster than normal cells and adapt to different microenvironments.
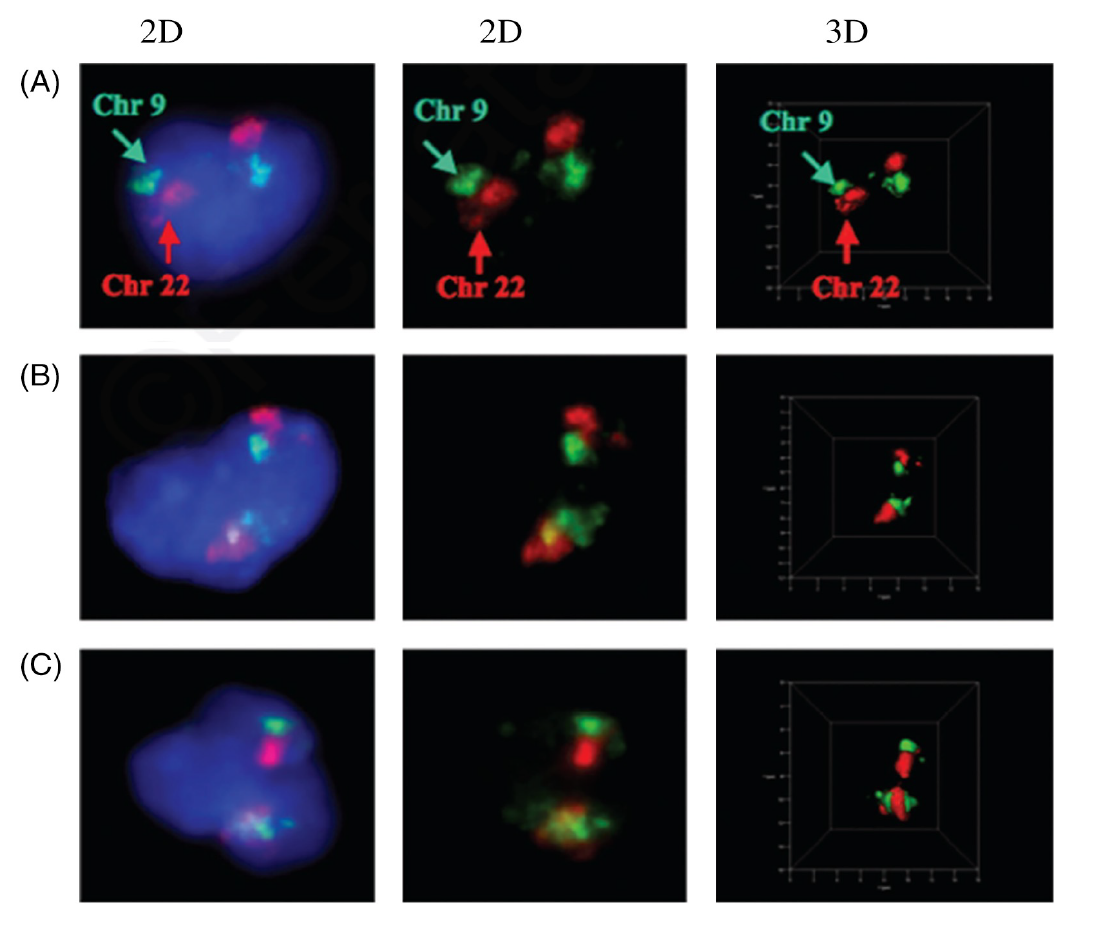
Figure 2 shows the rearrangement of two chromosomes (9 and 22) as found in chronic myeloid leukemia (Figure 2B and 2C). In contrast, these two chromosomes do not rearrange in normal white blood cells (lymphocytes) and are found in neighbouring positions (Figure 2A).
Scientifically speaking, the term genomic instability, which is a hallmark of cancer cells, defines changes that alter the genetic information of a cell. Such changes may involve small alterations, such as point mutations, or may be larger in nature and involve genes and chromosomes. The genetic information is reshuffled such that the cancer cell acquires the best possible growth and survival advantages over the surrounding normal cells.
The 3D organization of telomeres: normal and tumor cells
Telomeres are the ends of chromosomes. They protect the chromosomes from insults (DNA damage) and prevent illegitimate fusion(s) with other chromosomes. We have used the telomeric ends of chromosomes as surrogate structural biomarkers for genomic instability and have first defined their 3D organization in normal cells. This gave us the topographic landmarks of the nucleus that are required to assess whether telomeric and genetic changes occurred and how many changes were present in individual cancer cells.
In normal cells, telomeres show non-overlapping nuclear positions that are cell cycle-dependent. This means that a resting cell (in the Go/G1 phase of the cell cycle) has a 3D telomere organization that differs from a cell that is about to enter a cell division cycle (in the G2 phase of the cell cycle). 3D imaging that allowed us to map the positions of each telomere was used at the optical resolution limit of 200 nano meters (nm).
In tumor cells in general, telomere numbers and positions change; this is commonly due to the gain or loss of chromosomes. In addition, telomeres often appear in clusters, which we call telomeric aggregates. Such aggregates represent telomeres that are fused to each other or telomeres that are so close to each other that the optical resolution limit of 200 nm can no longer detect them as individual signals. Super-resolution microscopy overcomes this optical resolution limit and can resolve these aggregates into individual telomeres in close illegitimate vicinity. Telomeres in illegitimate vicinity are able to recombine with each other more frequently than would normally occur. Fused telomeres will give rise to chromosome breakages when cells divide (anaphase bridges and breakage-bridge-fusion cycles). These breakage events will cause further genetic changes as ‘breakage sites’ will be involved in further fusions and breakage cycles and render the aberrations of the genome more complex. Finally, the cell cycle- dependent nuclear telomere organization is often altered in cancer cells. And, while telomere length decreases as a function of normal aging, cancer cells have stabilized their telomere length, even if telomeres have become critically short. They use pathways to stabilize telomeres, most often by the enzyme telomerase. We often observe that aggressive tumor cells that underwent many cell divisions have very short telomeres.
Determining the nuclear architecture and genomic instability to understand and better treat Hodgkin’s Lymphoma
I am choosing Hodgkin’s Lymphoma as an example representative of many of our studies into the nuclear architecture of the cancer genome.
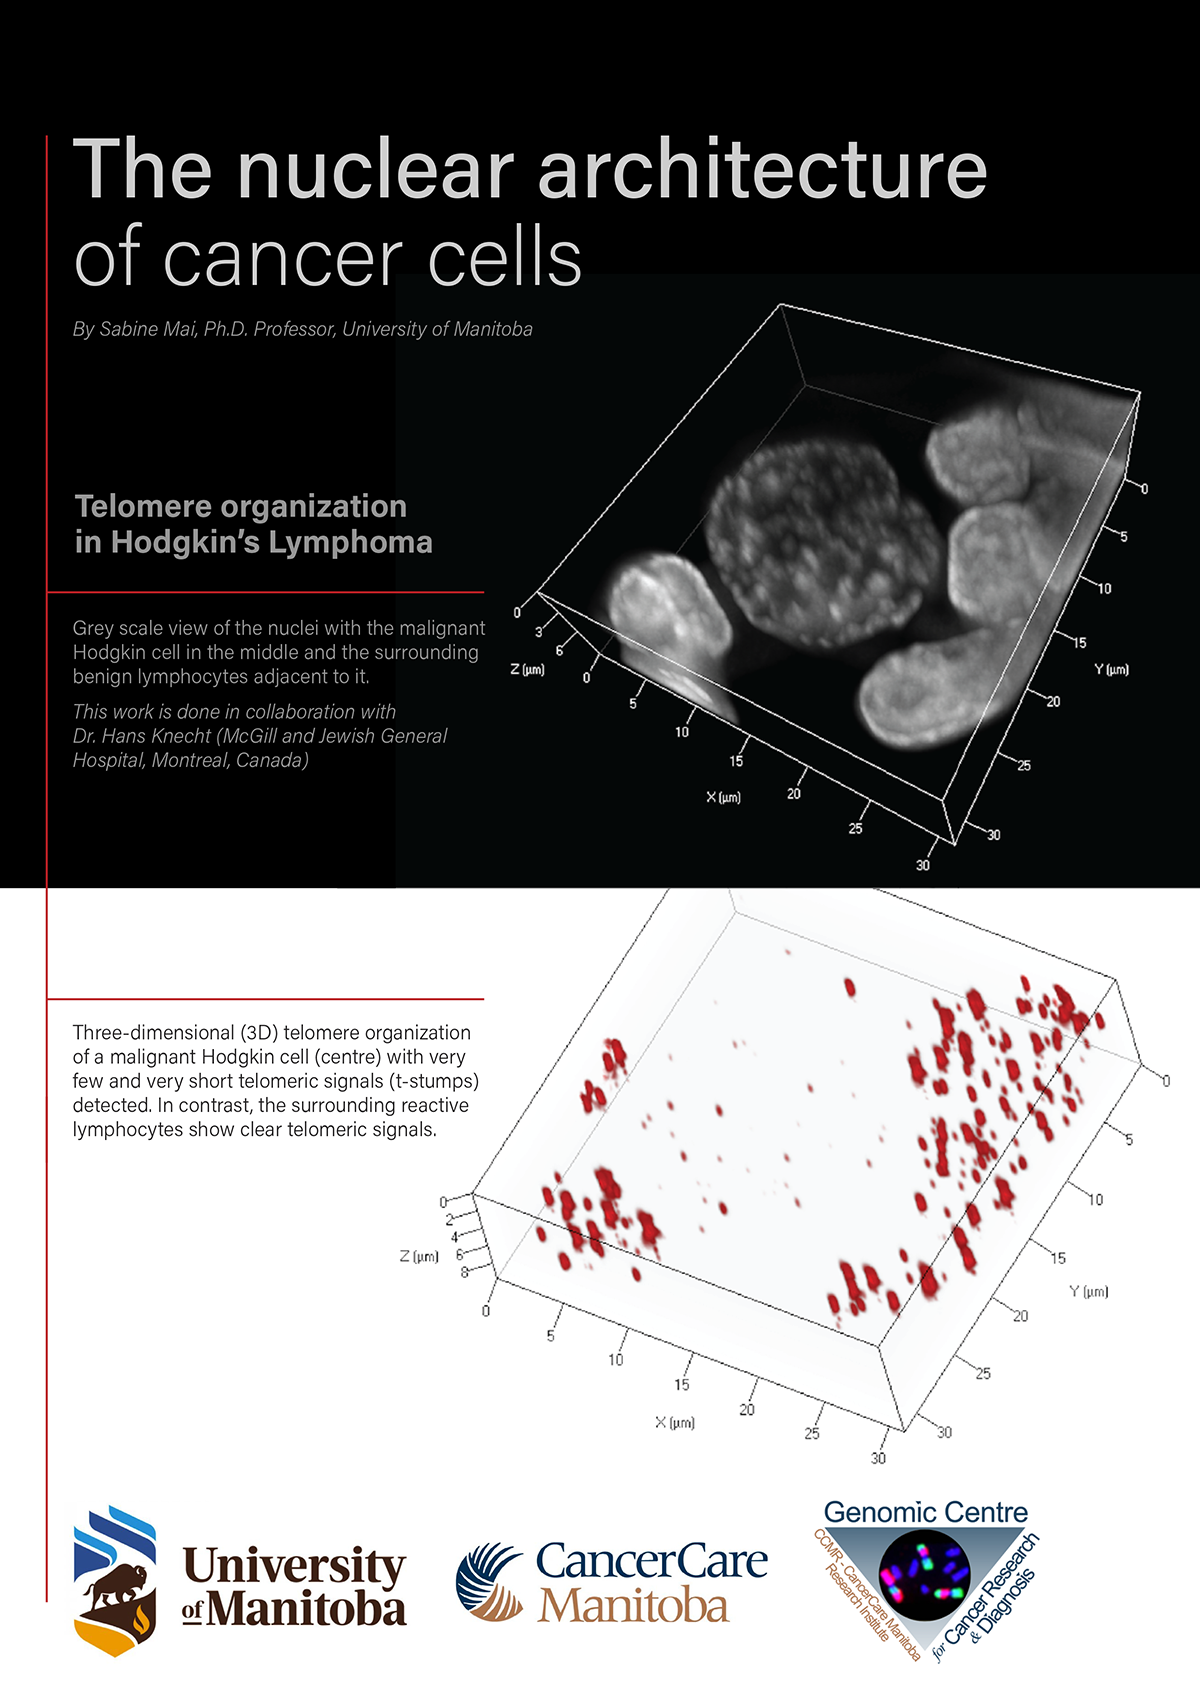
In collaboration with Dr. Hans Knecht (McGill University and Jewish General Hospital, Montreal, Canada), we have studied the 3D nuclear genome organization of Hodgkin’s Lymphoma (HL). This disease globally has 83,000 new diagnoses and 23,000 deaths annually. The 5-year relative survival rate is 89.1 % (seer.cancer.gov).
In an effort to understand the genomic architecture of HL, we have analyzed the 3D nuclear organization of telomeres (see cover illustration). This was possible with 3D imaging and analysis tools we co-developed with our colleague Dr. Yuval Garini (The Technion, Haifa, Israel) and his team (at that time at Delft University of Technology, Delft, The Netherlands). The 3D analysis tool (TeloView) we developed was then patented and now belongs to Telo Genomics Corp. (Toronto, ON, Canada), a biotech company that I co-founded. Its mission is personalized (precision) medicine for cancer patients using the structural biomarker provided by the 3D telomere organization of the cancer cell as a unique and defining feature of disease stability or aggressiveness.
The 3D organization of telomeres: Hodgkin’s lymphoma
Hodgkin’s Lymphoma is a tumour of small, mononuclear white blood cells (called B lymphocytes) and has two characteristic cell types; the diagnostic bi- to multinucleated Reed- Sternberg (RS) cell and the mono-nucleated Hodgkin (H) cell. Our first collaborative study on Hodgkin’s Lymphoma allowed us to identify a telomere-dependent pathway that generates the diagnostic RS cell. The origin of this RS cell had remained enigmatic for decades. We showed that it develops through telomere dysfunction, measured by 3D imaging and analysis. We ultimately showed that RS cells can no longer divide because they accumulate too many extremely short telomeres (called t-stumps) as well as unprotected telomeres and the genomic instability associated with both. Such RS cells are end-stage cells and incapable of further divisions.
Genome structure after telomere dysfunction
Telomere dysfunction is at the origin of the diagnostic RS cell. What happens to the cell genome and its architecture when the 3D telomere order is compromised? In another collaborative study with Dr. Knecht we addressed this question, and we documented in HL that telomere fusions create breakage-bridge fusion cycles and reshuffle the genetic information. Using an imaging method called spectral karyotyping (SKY), we showed the increased complexity of structural and numerical chromosomal aberrations from H to RS cell. Our most amazing findings included an RS cell with over 300 chromosomes that were completely engaged in chromosomal fusions and H cells with single chromosomes that underwent multiple breakage-bridge fusion cycles.
From the above summary, we conclude that Hodgkin’s Lymphoma cells have rearranged the rooms of the house we started to talk about. Yes, and in addition, they have re-ordered the positions of chromosomes. As we investigated in three patient-derived Hodgkin’s Lymphoma cell lines, the positions of selected chromosomes are altered. Not only are they found in positions that they usually never occupy in normal lymphocytes, but they also assume varying locations when compared on a cell to cell level. In analogy to the house, this means that each room with a new order of furniture is in addition at a different location (kitchen below the roof in one house, in the cellar in another house). For the cancer cell, this means that it has endless options to develop new subclones with different growth and survival properties suitable to different microenvironments and able to escape treatment(s).
DNA structure with super-resolution microscopy
Super-resolution microscopy overcomes the conventional optical resolution limit. Using this method, we have shown that H cells and RS cells have increasingly more interchromatin spaces than normal lymphocytes. The packaging of the DNA is also less compact in H and RS cells than in normal lymphocytes. Overall, the increase in less packaged DNA and more interchromatin spaces is highest in RS cells compared to H.
This finding is important as the overall DNA organization is impacted in Hodgkin’s Lymphoma. We next investigated, in a small pilot study, whether there is an indication of distinct DNA structure in patients with relapsed disease as opposed to those who responded to treatment and were in long-term remission. Our data demonstrated that the super- resolved DNA structures of RS cells differed significantly between patients in long-term remission and patients with relapsed disease.
3D telomere organization in Hodgkin’s lymphoma patients with recurrent/relapsed disease
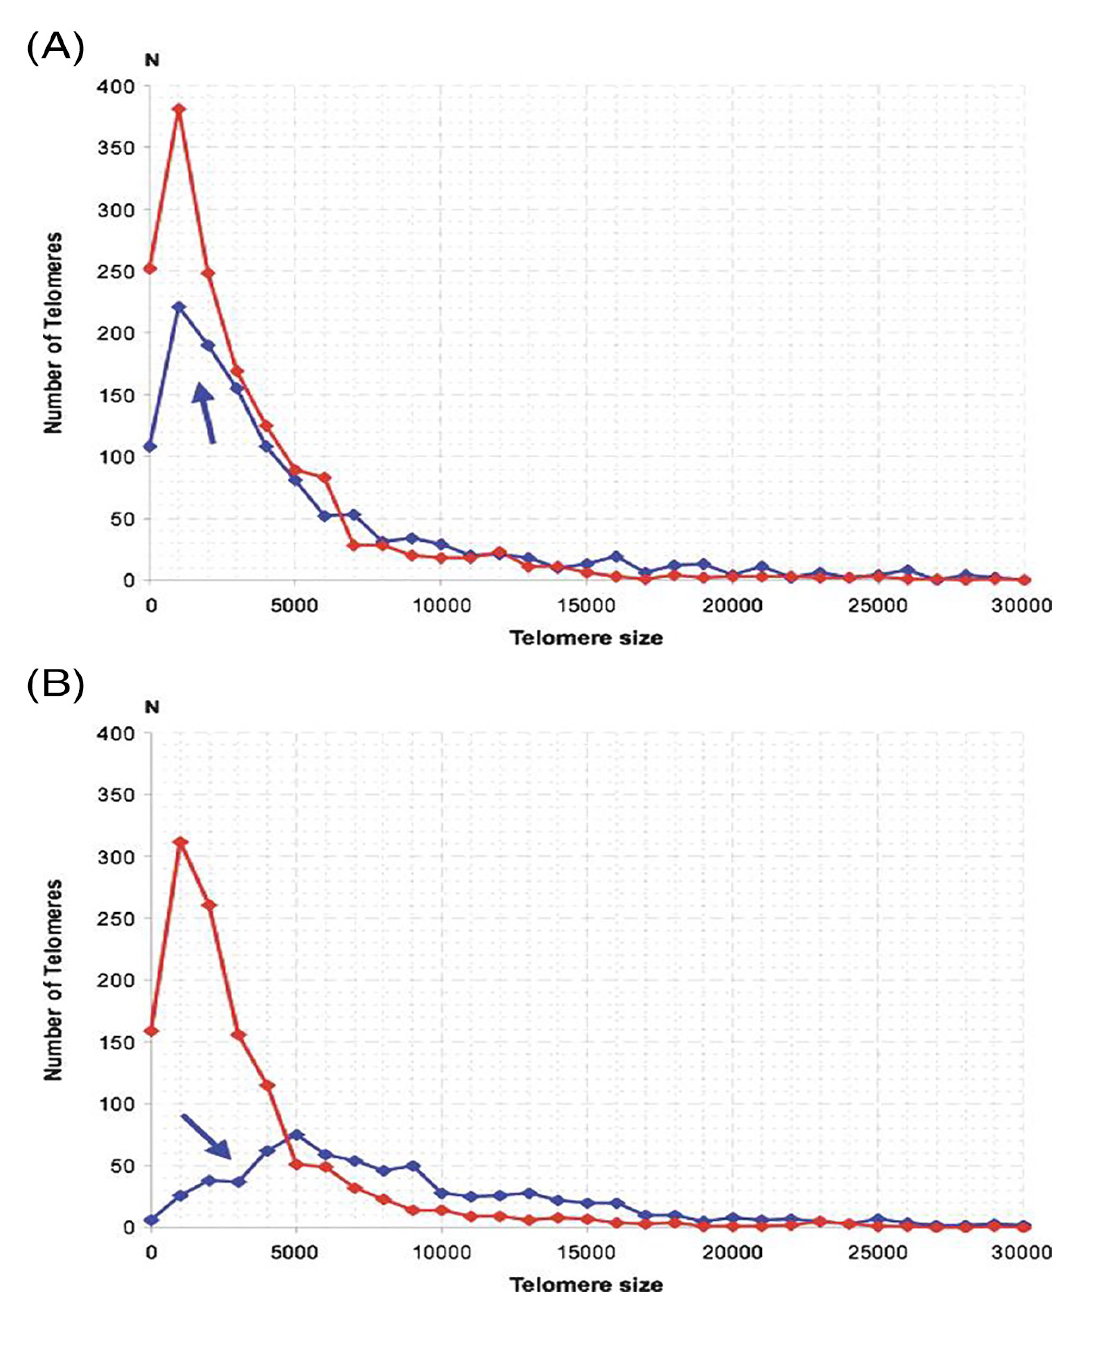
The study of Dr. Knecht’s Quebec Hodgkin’s lymphoma patient cohort with either treatment response and long-term remission or recurrent/relapsed disease, showed us that the 3D telomere organization was predictive of this outcome. Using diagnostic lymph node sections (the patients had not yet received any treatment), we were able to differentiate telomeric 3D profiles of patients who responded to treatment and of patients who had recurrent/relapsed disease. The most striking finding was that the 3D profiles of H and RS cells became very similar in patients with relapsed disease, while both H and RS cells displayed completely different profiles in patients with long-term remission (Figure 3).
Are the findings in Hodgkin’s Lymphoma applicable to other cancers?
Yes, they are. We have shown in Hodgkin’s Lymphoma and in multiple other cancers that the 3D telomeric organization and the super-resolution DNA structure of the nucleus are indicative of genomic instability, even the level of genomic instability and, therefore, cancer aggressiveness.
Multiple myeloma
Multiple myeloma, an incurable cancer of white blood cells with a 5-year relative survival of 57.9%, has 34,470 new cases per year in the United States and 12, 640 deaths annually (seer.cancer.gov).
In collaboration with the late Dr. Adebayo Olujohungbe and with Dr. Rami Kotb (CancerCare Manitoba, Winnipeg, Canada), we examined the 3D organization of telomeres in myeloma and its precursor lesions. We found that there is a distinct 3D telomere organization in precursors and in myeloma patient samples. Follow-up data of late Dr. Olujohungbe’s patient cohorts showed us that patients with stable disease and patients with progressive disease exhibited distinct 3D telomeric profiles.
Chromosome positions in myeloma and precursor cells showed variable locations, significantly different from each other and normal white blood cells.
DNA super-resolution structure increased in decompaction and interchromatin spaces from precursor lesion to myeloma.
Together, these data indicate that multiple myeloma displays a nuclear architecture distinct in different disease stages and in patients with stable vs. progressive disease.
Prostate cancer
Prostate cancer has an incidence of 268,490 in 2022 in the United States (seer.cancer.gov). In studies of the nuclear architecture of prostate cancer cells, we collaborate with Drs. Darrel Drachenberg and Jeff Saranchuk (CancerCare Manitoba, Winnipeg, Canada). We have studied liquid biopsies, that is tumor cells in blood samples from patients with prostate cancer. We have isolated the prostate cancer cells in the blood using a filtration-based method (ScreenCell, Paris, France) and confirmed the identity of the captured circulating prostate cancer tumor cells with cell surface marker staining. 3D telomere profiling was carried out on such samples. The first study we published described the feasibility of this method in prostate cancer and other cancers using liquid biopsies. The following prostate cancer studies from our group showed that circulating prostate cancer tumor cells can be found in all stages of the disease. Subsequently, we then focused on understanding a prostate cancer patient’s risk of progression. Studying treatment-naïve patients with intermediate-risk prostate cancer, we were able to risk-stratify the patients based on their 3D telomeric profiles. This work was supported by the Prostate Cancer Fight Foundation/Manitoba Motorcycle Ride for Dad.
Other cancers
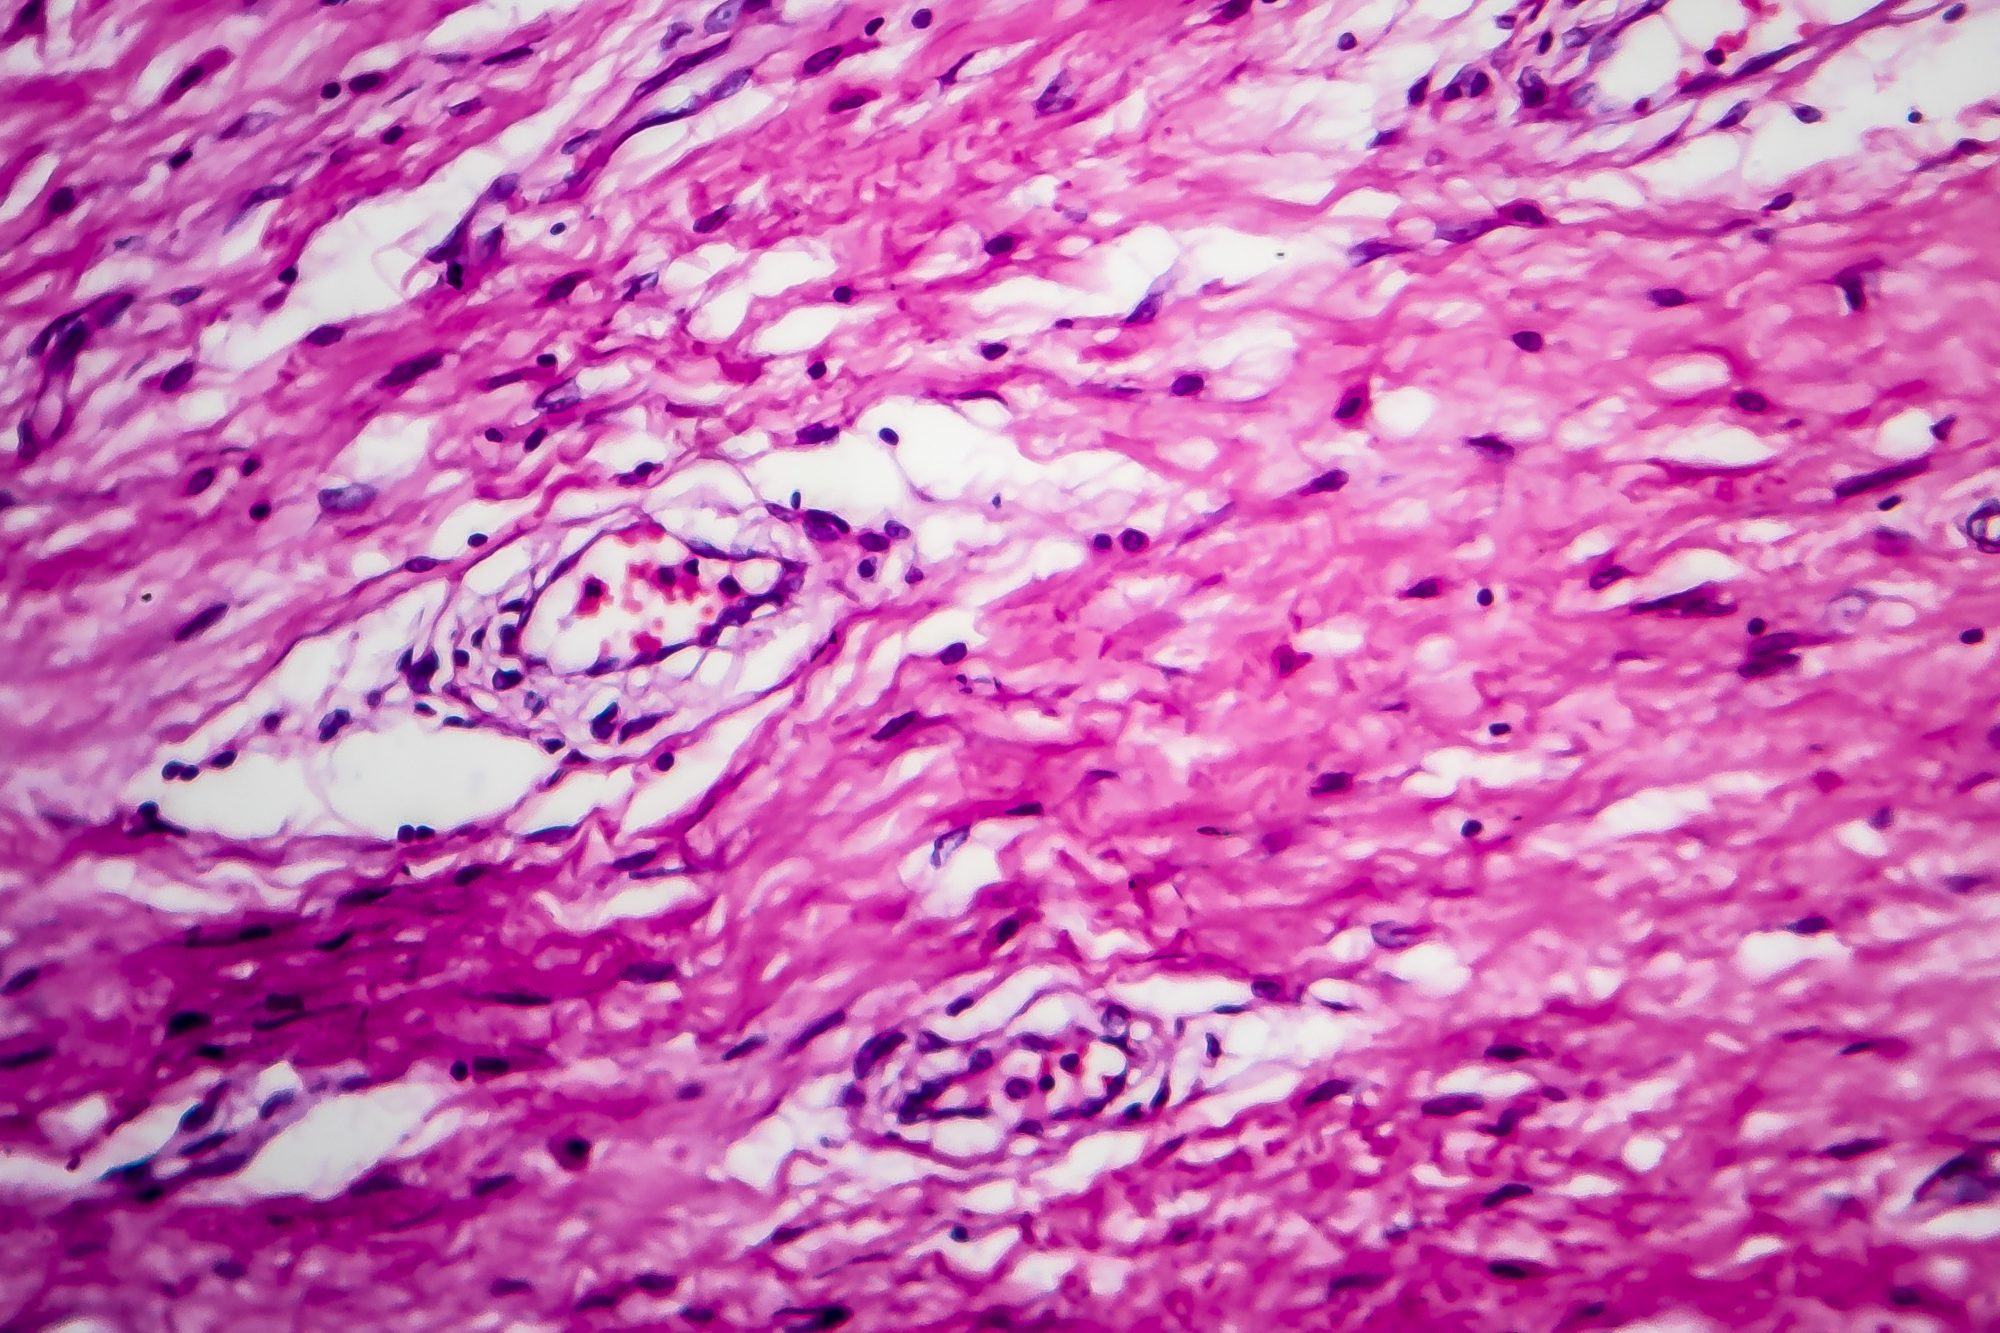
Our team and our collaborators have studied changes in nuclear architecture in additional cancers including brain tumors, head and neck cancer, cervical cancer (Figure 4), thyroid cancer, myelodysplastic syndromes and acute myeloid leukemia, chronic myeloid leukemia, and others.
biopsies. The following prostate cancer studies from our group showed that circulating prostate cancer tumor cells can be found in all stages of the disease. Subsequently, we then focused on understanding a prostate cancer patient’s risk of progression. Studying treatment-naïve patients with intermediate-risk prostate cancer, we were able to risk-stratify the patients based on their 3D telomeric profiles. This work was supported by the Prostate Cancer Fight Foundation/Manitoba Motorcycle Ride for Dad.
Other cancers
Our team and our collaborators have studied changes in nuclear architecture in additional cancers including brain tumors, head and neck cancer, cervical cancer (Figure 4), thyroid cancer, myelodysplastic syndromes and acute myeloid leukemia, chronic myeloid leukemia, and others.
The overarching principle is the same: the cancer cell nucleus shows an aberrant 3D genome in which structural biomarkers such as telomeres and super-resolved DNA structure are significantly and dynamically altered to promote tumor cell aggressiveness.
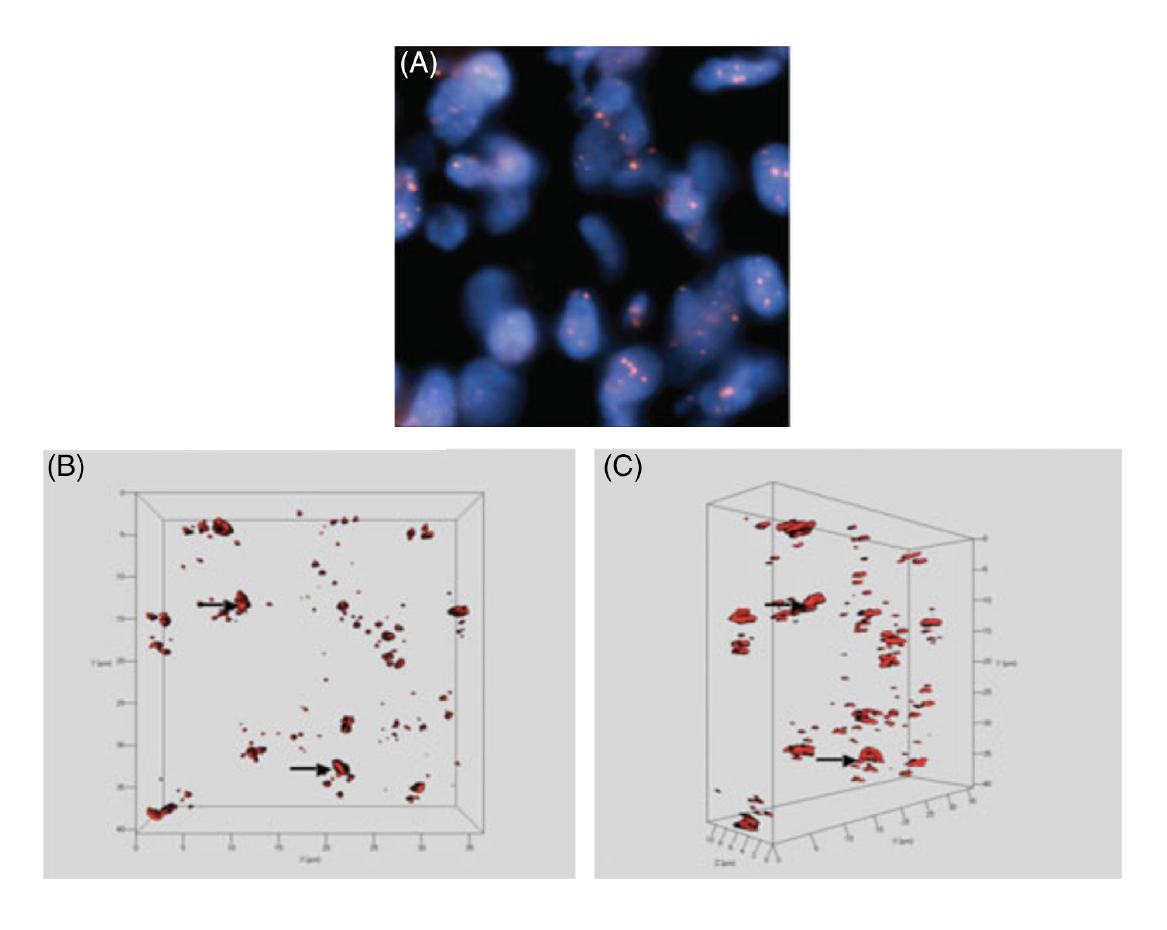
Figure 4 shows as an example the 3D telomere organization in cervical cancer.
Conclusions
Altered nuclear architecture and genomic instability are features of cancer cells. We have studied the cancer cells’ nuclei using 3D imaging and super- resolution imaging. We have identified structural hallmarks including telomeres, chromosome positions and nuclear DNA structure as surrogate markers for cancer cells, cancer stages and a patient’s risk of progression.
“The following prostate cancer studies from our group showed that circulating prostate cancer tumor cells can be found in all stages of the disease. Subsequently, we then focused on understanding a prostate cancer patient’s risk of progression.”
Find the full eBook and author information here