Masahiro Yoshida from Waseda University’s Department of Political Science and Economics finds that global warming raises summertime unemployment
Does temperature shape the “temperature” of the economy?
Since the Great Depression in the 1930s, the unemployment rate has been a central input to policy debates (e.g., fiscal and monetary policy, minimum wage legislation). It has long been monitored as a “temperature” of economic health (Beveridge, 1931) because joblessness hampers households’ ability to smooth consumption, undermines mental health, and even elevates crime and suicide risks.
Despite high policy interest in the real-time releases and short-term forecasts of unemployment rates, little is known about the mechanisms underlying high-frequency unemployment dynamics – presumably because economists emphasise long-run trends and cycles and therefore routinely smooth out unemployment fluctuations through seasonal adjustment.
However, we document that joblessness is highly seasonal, shaped, for example, by year-end shopping seasons and summer school closures. To uncover this “black box”, we directly relate the unadjusted unemployment rate to the most seasonal and spatially variable factor – temperature.
The case in the U.S.: Demand for less labour?
We begin by comparing seasonal changes in the unemployment rate in summer and winter with their corresponding temperature exposures.
Figure 1a plots the national experience of hot days in summer (Q2-Q3) and cold days in winter (pre Q4-Q1), respectively, alongside the half-year change of unadjusted unemployment rates in 1950-2019. Despite the limited sample of 70 years, we find a statistically significant positive slope.
Analogously, Figure 1b illustrates the temperature–unemployment nexus across U.S. states, comparing summer and winter unemployment over 1990–2019. In the summer, hot states (e.g., Florida, Arizona, Texas) experienced a larger increase in unemployment rate relative to cold states (e.g., Minnesota, Michigan, Wisconsin). In contrast, in winter, cold states experienced a relatively larger increase in unemployment rate. We hypothesise that the arrival of hot summers and cold winters fuels regional unemployment rates – extreme-temperature days would significantly hurt labour efficiency by increasing fatigue, operational errors, and workplace injury risk, and thus lead to a reduction in labour demand.
U.S. counties as a “Laboratory”
To formally test this prediction, we newly built a spatial panel data connecting plausibly-random exposure to the monthly distribution of daily temperature drastically varying across U.S. counties, and unemployment rates during 1990-2019. We statistically isolate temperature impacts from nationwide business-cycle and calendar effects (e.g., annual contracts; school graduations in May). We find that 10 additional extreme-temperature days per month (hot days above 75°F and cold days below 50°F) increase the monthly unemployment rate by 0.2-0.3% points, respectively. Notably, the relationships become insignificant when using commonly used seasonally adjusted unemployment data. Using quarterly state-level worker-flow data from JOLTS (Bureau of Labor Statistics), we also find that hot days slacken the labor market primarily by reducing job openings and by triggering both layoffs and quits.
Accounting
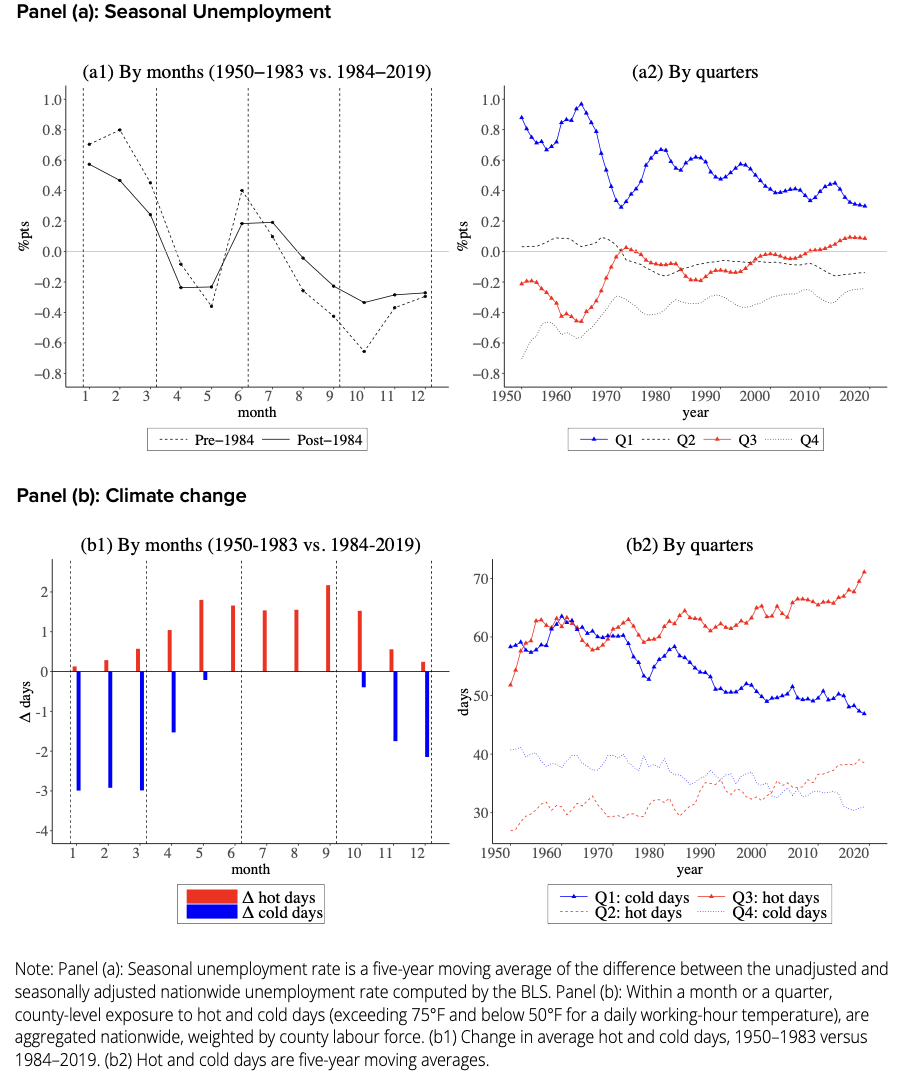
Based on the estimation, we evaluate the role of climate in the level and dynamics of unemployment. A back-of- the-envelope calculation suggests that extreme hot and cold days account for 12-14% of the within-year unemployment rate. In parallel with the ongoing global warming, which accelerated around 1980, we document that the volatility of seasonal unemployment has declined over time (Figure 2a). Comparing pre-warming 1970s (1970-1979) with the new century (2001-2019), we compute that climate change accounts for about 8-10% of the shrinking variance in unadjusted unemployment rates through harsher summers and mild winters (Figure 2b).
Policy implication
Finally, we show that weather shocks also increase statewide monthly unemployment insurance claims and receipts, underscoring their fiscal consequences. Looking ahead, rising temperatures fuel joblessness in the summer, reverse the long-run moderation of unemployment volatility, and widen related fiscal burdens. These patterns highlight the need for strengthened job-security programs as summers grow increasingly hot.