
Do restaurant servers walk more than 10,000 steps in a shift? Dr. Doyle-Baker discusses energy expenditure in relation to occupation and leisure activity
The greatest declines in physical activity (PA) along the lifespan often occur in late adolescence and young adulthood. During this transition period many young people enter the workforce for the first time and their daily energy expenditure (EE) becomes a combination of occupational physical activity (OPA) and leisure time physical activity (LTPA). A limited number of studies however, have focused on the influence of different occupations on total daily energy expenditure. In the literature OPA is underserved and underrepresented, yet it may have important implications particularly in this vulnerable age group where health habits may still be evolving.
Employment: wait staff at restaurants
The largest employer of young people in Canada is the foodservice industry. There are over one million employees in this industry, with food and beverage server’s providing the largest percentage at 20% (https://www.restaurantscanada.org/about-us/). The industry provides one in five jobs and therefore provides an opportunity, to observe whether those involved in OPA meet daily PA recommendations.
Canadian Physical Activity Guidelines: step counts
The Canadian Physical Activity (http://csep.ca/CMFiles/Guidelines/CSEP_PAGuidelines_0-65plus_en.pdf) guidelines recommend that those aged 18-64 years old accumulate at least 150 minutes of moderate-to vigorous-intensity aerobic physical activity (MVPA) per week, in bouts of 10 minutes or more. According to the Centers for Disease Control and Prevention in the USA, walking about 7,000 to 8,000 steps will meet this PA guideline (Tudor-Locke, Bassett 2004) and more steps, such as 10,000 is equivalent to walking 8.05km or 5 miles. Step counts can be objectively and easily measured with wearable devices, such as pedometers and accelerometers.
Wearable Devices: accelerometers
Although, recording the number of steps-per-day was deemed important our primary objective was related to EE and based on a true value of resting energy expenditure (REE). We needed a device that allowed for integrated features for REE input, low power consumption, and preferably not wrist based because the servers felt it might interfere with carrying dishes and plates. The AMP 331 (Dynastream Innovations Inc., 2003) accelerometer was selected because it had been validated in a field setting (University of Calgary) with a young adult age population and was worn on the ankle. Stride length and speed in this accelerometer were determined by tracking the path of the lower limb and foot through space.
REE: total number of calories body burns at rest
Participants’ REE was measured via indirect calorimetry and inputted into the accelerometer prior to data collection thereby over riding the programmed prediction equation. At a group-level the well-known Harris-Benedict and Mifflin equations are suitable for predicting REE but at an individual level, both equations have wide limits of agreement and overestimate REE. A metabolic cart (Parvomedics TrueMax 2400) with a ventilated hood system was used to measure REE. Participants followed the fasting protocol and refrained from exercise prior to the test. Respiratory exchanges measures were collected for 30 minutes, with mean expired gases (oxygen consumption (VO2), and carbon dioxide production (VCO2)) averaged every five minutes and the Weir formula (1949) was used to convert the VO2 and VCO2 values to ml/min.
Recruitment: 85%males
Seven healthy participants’ (1 female) ranging in age from 23-29 years were recruited from two full-service restaurant establishments in Calgary (Alberta) and wore the accelerometer for seven consecutive days (4 working days). The data was analyzed using the AMP Ware Minute Software (Dynastream Innovations Inc., 2004) designed to compute: 1) EE, 2) metabolic equivalent (MET) values according to activity class and walking speed, and 3) the time in each class/speed. Hourly working EE values were converted to METs (based on the conversion factor of 1kcal/kg/hour = 1MET). Participants recorded in a journal their working and non-working hours and any other activity such as LTPA.
Results: the good and the bad news
Participants met the minimum Canadian PA levels on each working day by accumulating at least 60 consecutive minutes of light intensity activity each day (males ≥ 1.6 METs; females ≥ 1.2 METs). They did not achieve ‘vigorous’ status based on the occupational classification of 7+ METs. Their total PA was comprised predominantly of OPA, with none of the servers engaging in LTPA before or after their OPA. Their total hourly EE and step counts were higher for working versus non-working days, and working versus non-working periods.
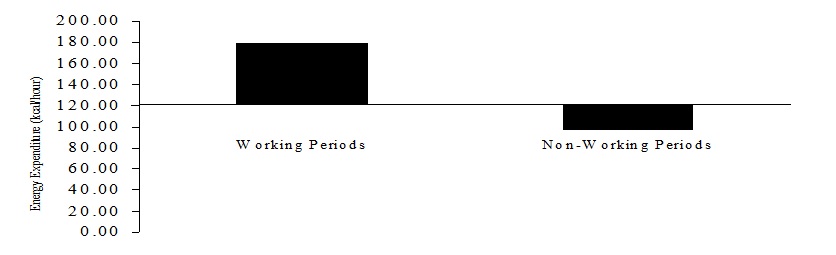
Energy Expenditure: Hour by hour
There were substantial differences between working and non-working daily EE. Males expended approximately 26% (598 kilocalories (kcal)) more on working days than non-working days and the female expended approximately 25% (457 kcal) more on working days than non-working days. When comparing hourly working EE to hourly non-working EE (both working and non-working days), the differences were considerable. Hourly working EE for the males, on average, were approximately 84% (82 kcal) higher than hourly non-working EE and the female was approximately 79% (61 kcal) higher (see Figure 1).
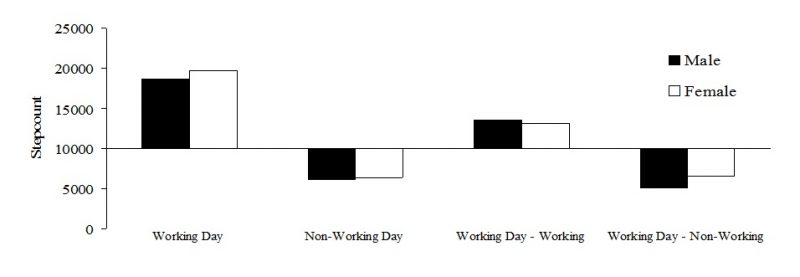
10,000 steps per day: a dilemma
Perhaps it is not surprising that a server in a busy restaurant would exceed 10,000 steps during a shift. While working, males accumulated 13,589 and the female 13,141 step counts and their overall totals during 24 hours on a working day were 18,682 and 19,753 steps counts, respectively (Figure 2). Participants, however fell well below this on non-working days accumulating 6138 (males), and 6403 (female) step counts.
Summary
This study provides insight into PA surveillance data for a population of young adult restaurant servers. These results highlight, that while this group was successful at meeting and exceeding their age- and sex-specific norms and PA recommendations during working days, this was not the case on non-working days. While it is true that during periods of full-time employment, this group will derive health benefits from their working PA levels, if and when their employment ceases their LTPA would have to become the major contribution to daily EE. Given that their LTPA levels were substantially below normative data (essentially zero), and habits are often well established by this age, the health implications of this are of concern. These findings could be useful in directing prevention and intervention strategies for this specific population, both during their foodservice employment and beyond. The idea of keeping the message simple when it comes to PA is highlighted in the following health promotion strategy: “Be active on most days of the week. If you can be active every single day, that is even better.”


