
Shareholders have three basic objectives for top executive pay: create strong incentives to increase shareholder value, retain key talent and limit shareholder cost
We can measure a company’s success in achieving these three objectives by calculating relative pay, relative performance, and the trendline relationship. Relative pay is actual pay divided by market pay, and relative performance for top executives is actual shareholder wealth divided by expected shareholder wealth based on industry performance.
The trendline relating log relative pay to log relative performance gives us four pay dimensions: the slope of the trendline is pay leverage, a measure of incentive strength; the correlation is a measure of alignment; the intercept is the pay premium at industry average performance, and the slope divided by the correlation is relative pay risk.
Pay leverage measures the company’s success in creating a strong incentive to increase shareholder value. The intercept is a positive measure of shareholder cost and a negative measure of retention risk.
We can also calculate relative pay, relative performance and the pay vs performance trendline for U.S. professional baseball players, and when we do so, we get some interesting perspective on U.S. executive pay.
Major League Baseball prohibits most incentive pay, so pay is related to expected, not actual, performance. Our measure of the financial value of expected performance is the contribution to team value provided by the player’s expected wins above replacement (WAR).[1]
Figure 1 shows log relative pay plotted against log (1 + relative TSR) for CEOs. The sample is U.S. CEOs reported in the new proxy statement’s pay vs performance disclosure. This disclosure reports a five-year history of pay on a mark-to-market basis. Mark-to-market pay captures the incentive provided by changes in the value of unvested equity compensation.
We limit the sample to CEOs in office for all five years. We measure relative pay and relative performance on a cumulative basis for 1, 2, 3, 4 and 5-year periods. This gives us 4,775 observations of relative pay and relative TSR for a total of 955 CEOs.
Figure 1 shows a 20% sample of these 4,775 observations.[2]
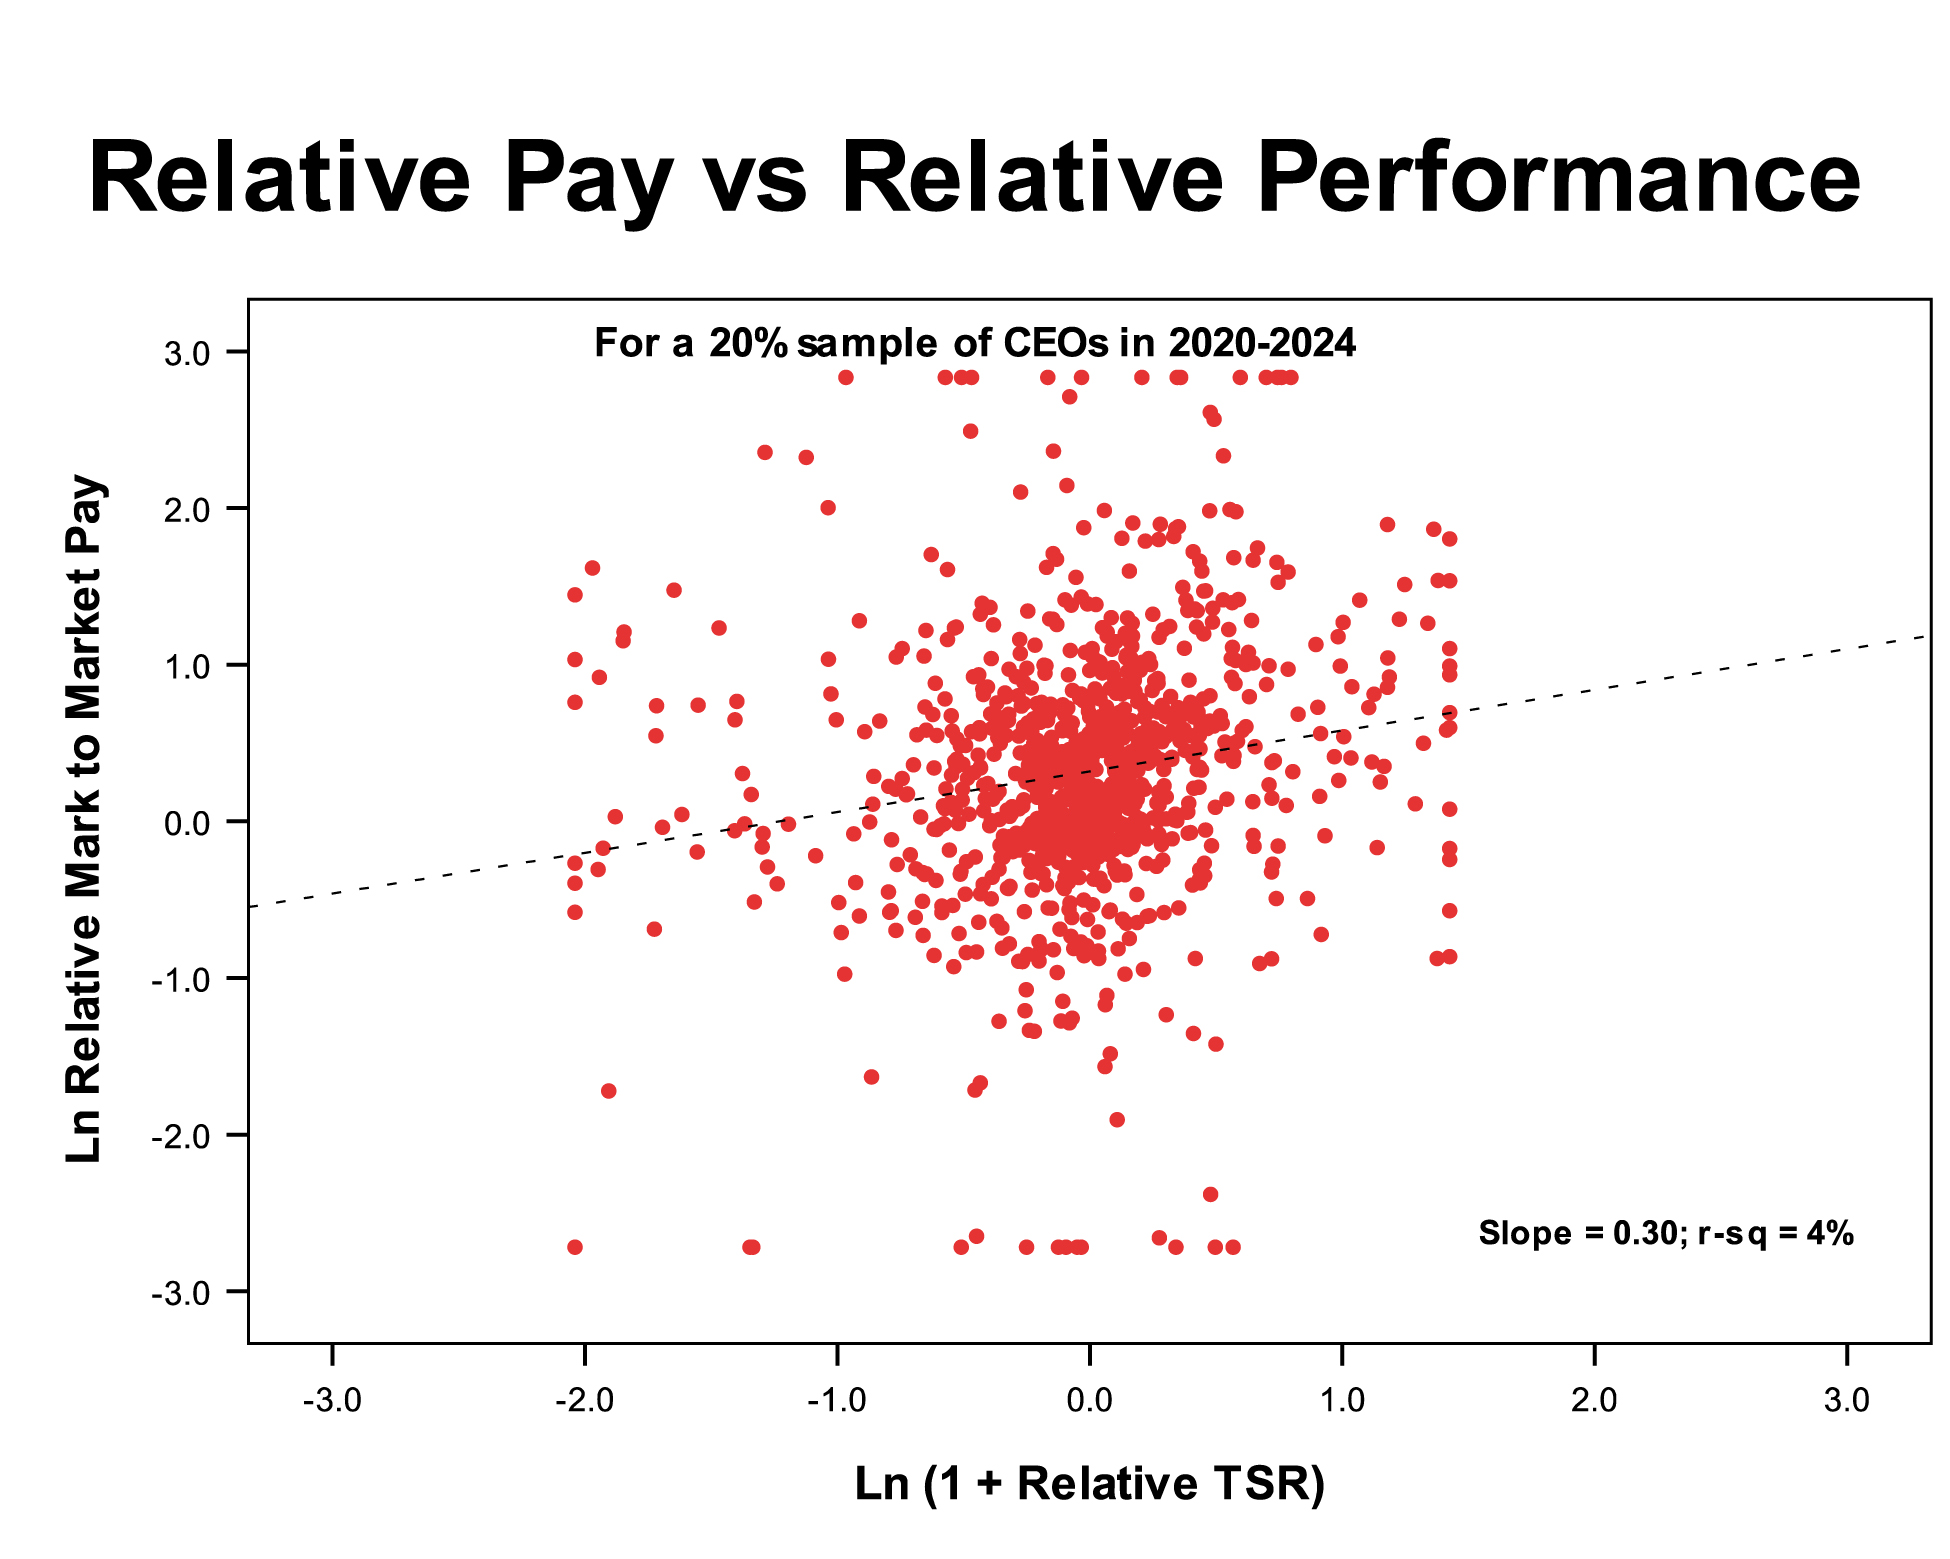
Figure 2 shows log relative pay plotted against log relative expected value added for baseball players. We limit the sample to baseball players with at least five years of consecutive service in the years 2000-2025. We measure relative pay and relative performance on an annual basis. The sample is 3,307 annual observations of relative pay and relative value added for a total of 440 players.[3]

Comparison of Figures 1 and 2 shows some surprising results. Baseball players’ pay is almost twice as sensitive to performance as CEO pay. A doubling in expected value added increases baseball player pay by 43%, while a doubling in shareholder value increases CEO mark-to-market pay by only 23%, and increases CEO grant date value pay by only 7%.[4]
We can also see that relative performance explains 23% of the variation in baseball player pay, but only 3% of the variation in CEO mark-to-market pay (and only 1% of the variation in CEO grant date pay). The low sensitivity of CEO mark to market pay to performance is particularly surprising since CEOs receive most of their pay in stock.
Why is there more pay for performance among baseball players?
Some CEOs have more pay for performance than baseball players. We can calculate the pay vs performance trendline separately for each CEO, and if we pick out the CEOs with pay alignment (r-sq) of 50%+ and pay premiums at industry average performance within +/-25%, pay leverage x ln(1 + relative TSR) explains 82% of the variation in relative pay among these CEOs.[5] Unfortunately, these CEOs represent only 10% of the sample. What makes them different from the vast majority of CEOs?
There are two big differences between the high alignment CEOs and the rest. First, grant date pay has 10x greater sensitivity to pay leverage x ln(1 + relative TSR), 0.351 vs. 0.035. Second, post-grant date value changes are 5x more sensitive to pay leverage x ln(1 + relative TSR), 0.637 vs 0.128.
The vast majority of CEOs have low grant date pay sensitivity because their directors embrace a competitive pay policy. Competitive pay policy says that target pay should be the 50th percentile pay regardless of past performance. This gives target pay zero correlation with trailing relative TSR. Since the grant date pay largely reflects target pay, the competitive pay policy also gives the grant date pay a very low correlation.
Conventional wisdom holds that performance share vesting can provide a perfect correlation of relative pay and relative TSR even though target pay is completely uncorrelated with trailing relative TSR. This requires post-grant date value changes to closely track relative TSR. But the data show that the vast majority of companies struggle to achieve high alignment through post-grant date value changes.
It’s very surprising that baseball players, who have no formal incentive pay, have more pay for performance than CEOs, who get most of their pay in stock. A small group of companies have more pay for performance than baseball players, but they depart from the conventional wisdom that endorses competitive pay policy, and they do a much better job of linking stock vesting to relative TSR. Directors, compensation consultants and proxy advisors need to measure and manage pay sensitivity to performance.
References
[1] We use the WAR measure calculated by Baseball Prospectus, available at www.baseballprospectus.com. Our estimate of expected WAR is 1.25 + 0.38 x WAR[-1] + 0.21 x WAR[-2] + 0.11 x WAR[-3] – 0.1 x [age – 21]. We use a regression relating log inflation adjusted team value to expected net wins to quantify the financial value of WAR. Each expected net win increases team value by 0.9%. We use team values for 2000-2025 estimated by Forbes magazine.
[2] The slope and r-squared are for all 4,775 cases, not the 20% sample.
[3] The slope and r-squared for all 3,775 cases, not the 30% sample.
[4] (2^0.52 – 1) = 43%; (2^0.30 – 1) = 23%. The regression of CEO relative grant date pay on relative TSR has a slope of 0.10 and an r-squared of 1%; (2^0.1 – 1) = 7%. Grant date pay, long reported in U.S. proxy statements, includes equity compensation based on its value at the date of grant.
[5] If we don’t adjust for differences in pay leverage, the trendline slope is 0.58 and the r-squared is 54%. For the full sample, adjusting for differences in pay leverage reduces the slope from 0.30 to 0.19 and reduces the r-squared from 4% to 2%.


