.women Hand giving and receiving money from businessman.")
Stephen F. O’Byrne of Shareholder Value Advisors asserts that companies need model pay plans to improve pay-performance alignment
Aligning relative pay and relative performance is widely accepted as the most crucial objective of executive pay, but studies show that most companies have low alignment. Achieving high alignment requires three things: comprehensive measures of pay and performance, a meaningful way to measure alignment, and a model pay plan that achieves high alignment. All three are now available to companies, but there has been little progress in raising alignment.
The key players in governance, including the leading proxy advisor Institutional Shareholder Services (ISS), major institutional investors, and compensation consulting firms, have been a significant obstacle to progress. They have bad measures of alignment and don’t provide model plans to show how high alignment can be achieved.
Mark-to-market pay
The best comprehensive measure of pay is “mark-to-market” pay, which captures changes in the value of equity compensation after the grant date. U.S. companies now report a five-year history of mark-to-market pay in their “Pay Versus Performance” (PvP) disclosure.
Figure 1 shows that we can use this data to measure alignment. The graph plots relative pay on the vertical axis against relative total shareholder return (TSR) on the horizontal axis for Verizon CEO Hans Vestberg. Relative pay and relative performance are both measured on a cumulative basis from the start of 2020.
The slope of the line, 0.23, is a measure of incentive strength, what we call pay leverage. It tells us that a 1% increase in relative shareholder wealth results in a 0.23% increase in Vestberg’s relative pay. The correlation of 0.44 is a measure of alignment. The intercept, -0.30, is a measure of performance-adjusted cost, i.e., the pay premium at industry average performance. It tells us that Verizon pays 26% below market at industry-average performance. (1) The slope divided by the correlation gives us a measure of relative pay risk.
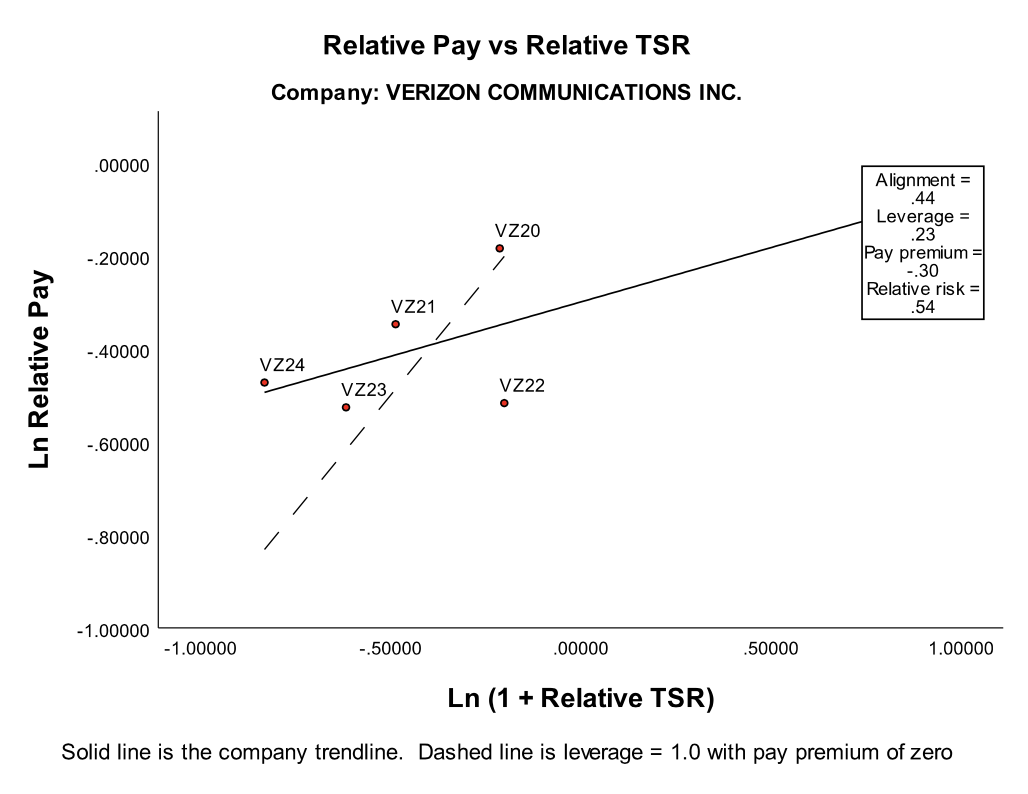
Verizon’s pay alignment of 0.44 means that relative TSR explains only 19% (= 0.44 x 0.44) of the variation in Vestberg’s relative pay over the past five years. The average public company has done better but not well. The mark-to-market data reported by 1,097 companies in their 2024 PvP disclosures shows an average alignment (r-sq) of 0.44. My historical estimates of mark-to-market pay from grant data show that CEO pay alignment (r-sq) has averaged 0.47 over the years 2013-2024.
We can’t expect companies to achieve high alignment until they know a plan design that consistently delivers high alignment. The dashed line in Figure 1 shows the result of a simple pay plan with annual grants of performance shares. It has an alignment of 1.0, a pay leverage of 1.0, and a zero pay premium at industry average performance.
The plan differs from conventional pay practice in three ways. First, target pay is not market pay, but market pay adjusted for trailing relative performance. Second, the vesting multiple is not [1 + rTSR], but [1/(1 + iTSR)], where iTSR is the industry return from the date of the grant. Third, base salary is treated as a draw against the value of the performance shares, not an independent entitlement.
A fundamental difference between this perfect correlation pay plan and conventional practice is the role of fixed sharing. The perfect correlation pay plan makes cumulative pay equal to the cumulative future value of market pay plus a fixed and symmetric share of the excess return. Fixed sharing creates strong incentives and high alignment. Conventional pay plans don’t have fixed sharing. In fact, they make sharing subject to an inherent “performance penalty”.
Improving pay-performance alignment
Conventional pay plans have target dollar pay, typically 50th percentile pay in the labor market, so an increase in the stock price must be penalized by a reduction in equity grant shares to avoid exceeding target dollar pay, while a decline in the stock price must be rewarded with an increase in equity grant shares to achieve target dollar pay. In other words, superior performance is penalized by a reduction in sharing percentage, while poor performance is rewarded by an increase in sharing percentage.
ISS does not provide a model pay plan that provides perfect alignment. Indeed, “ISS does not advocate that companies utilize any particular metric in the compensation program.” (2) Major institutional investors and compensation consulting firms don’t provide model pay plans either.
If ISS did accept the discipline of providing a model pay plan, it would realize that it has a very poorly designed measure of alignment. Its measure of alignment, what it calls “Relative Degree of Alignment (RDA),” is the difference between a company’s three-year TSR percentile rank and the CEO’s three-year pay rank. It ranges from -100 when a company has high pay and low performance to +100 when a company has low pay and high performance. Zero represents a high degree of alignment.
The ISS alignment measure is one deviation from the trendline pay percentile = TSR percentile. It’s equivalent to using one deviation from the dashed line in Figure 1. One deviation from the trendline is a very poor proxy for the correlation. In a study of 15,860 five-year periods, I found RDA had a correlation of -.01 with pay alignment. (3)
Towards a model pay plan that achieves high alignment
The key players in governance, including major institutional investors and compensation consulting firms, as well as ISS, need to realize that their advocacy of high alignment will have little effect until they accept the responsibility to provide a meaningful measure of alignment and a model pay plan that consistently achieves high alignment.
References
- The intercept is in natural logarithms. The percentage pay premium is exp(-0.30) – 1 = 26%.
- ISS, “Pay-for-Performance Mechanics ISS’ Quantitative and Qualitative Approach”, Updated December 16, 2024, p. 5, available at issgovernance.com
- Stephen F. O’Byrne, “The ISS Pay for Performance Model”, available at ssrn.com/abstract=2289360.

This work is licensed under Creative Commons Attribution-NonCommercial-NoDerivatives 4.0 International.


 Project")
