
Researchers in the Ebenstein lab for nanobiophotonics at Tel Aviv University are using epigenetic marks to study genomic variation
Although the DNA sequence is identical in all the cells of our body, cells from different tissues look and function in a completely different form. Epigenetics is responsible for this. Epigenetic marks are small chemical modifications in DNA or to the proteins that wrap the DNA, and determine which genes should be turned on or off. The combination of our genes and our epigenetics is what makes us unique.
In the Ebenstein lab, we developed a method for labelling these epigenetic marks on the DNA by connecting fluorescent molecules to these marks. We also created a genetic barcode by labelling a specific sequence with a different fluorescent colour. This DNA is squeezed into nanochannels and visualised by a unique, powerful microscope. The result: Stretched DNA fibres decorated with colourful spots, which resemble beads on a string. The genetic barcodes guide us to the genomic location of the DNA molecules, and the epigenetic marks can then be mapped to the human genome. By comparing hundreds, or thousands, of molecules to each other and to the expected locations of these genomic regions, we can study genomic variation – specifically the differences between individual cells – and perhaps track down unique cell populations with distinct genetic and epigenetic properties, like cancer cells. We can also study the mechanisms that control turning genes on or off.
Epigenetic marks are altered during the development and progress of some diseases, including cancer. In different blood cancer types, the level of the epigenetic mark 5hmC in blood cells is reduced dramatically. Therefore it can potentially serve as a biomarker for diagnosis and monitoring of the disease. Due to the extremely low levels of this mark in the blood, it has been extremely challenging to measure its level. We have developed an ultra-sensitive method for measuring 5hmC levels in the blood. Using our labelling and visualisation approach, we can detect even a single 5hmC site along a single DNA molecule. Preliminary results measuring the 5hmC levels in the blood of cancer patients compared to healthy individuals show about a 30% reduction of the mark in cancer. This implies that measuring 5hmC levels in the blood may help detect and diagnose a disease. We are now working on collecting more data and establishing this method, in addition to adapting this diagnosis tool to other diseases.
Tslil Gabrieli, PhD student
My aim is to establish new methods that will open up a better view of our genome. By combining optical methods and biological enzymes that came from different bacteria and phages, we are able to fluorescently tag specific features in the human genome and epigenome. Our epigenome is considered as the level “above” the genome; it is heritable but also affected by the environment – diet, smoking and even memory – and it is known to change in cancer cells. It affects our development and the pattern of gene expression in each of our cells.
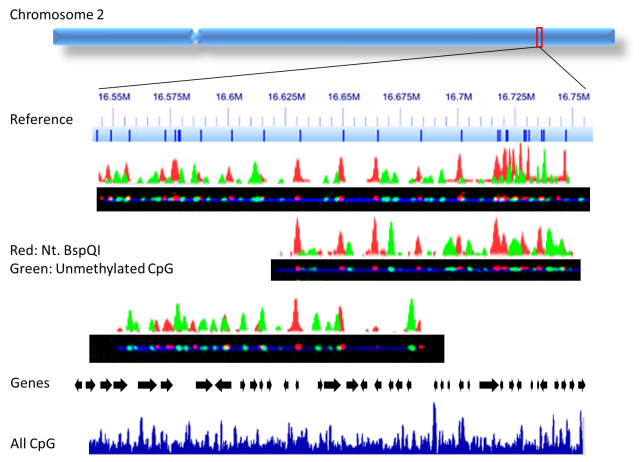
Another exciting field I’m working on is a method we recently developed, “CaTCh”, in which we target and isolate long DNA segments (1kb-1000kb) by cas9-endonuclease digestion. By combining our epigenetic-labelling methods and CaTCh in larger genomes, as in plants, animals and humans, we are able to study population variation in large genomic regions, that may be differentially marked by epigenetic modifications. We are able to specifically detect those genomic features – in red the genetic profile and in green the epigenetic profile.
Dima Torchinsky, PhD student
In our research we develop a technique to highlight specific types of DNA damage which we detect by optical means. DNA damage occurs spontaneously and causes degradation of the genetic content of the cells, which is being associated with various medical conditions and the risks of developing different illnesses. Using naturally-occurring enzymes that are responsible for repairing damaged DNA in living organisms, and tricking them to use fluorescent labels in the repair process, results in fluorescent tags on the DNA at each damaged site. When imaged, the DNA appears as elongated lines, and the damage sites as dots along the contour. By counting the number of dots and dividing it by the total length of sampled DNA, we receive a ratio which represents the amount of damage in the sample.
Assaf Grunwald, senior PhD student
M.TaqI is an enzyme that in nature transfers a methyl group from a co-factor called “AdoMet” onto its specific DNA recognition sequence (TCGA). I manipulate this enzyme by giving it a synthetic co-factor, so that instead of transferring the methyl group, a fluorescent molecule is being covalently incorporated by the enzymes to the same recognition sites. Stretching the DNA into a linear form and imaging it with fluorescence microscopy, results in light emission from the incorporated tags. Since the patterns of the tags are dictated by the DNA sequence, it can be used as identification for different organisms such as viruses and bacteria.
One interesting feature of the enzyme, which was discovered during my work, is that the enzyme is sensitive upon methylation of the cytosine base (C) that lies within its recognition sequence. Meaning that if a label is detected, then the site is not-methylated (an absence of labels indicates methylation). Since methylation of CG sites is a significant epigenetic mechanism in humans, responsible for gene regulation and disease, this labelling technique can provide important information regarding the epigenetic state of the cell.
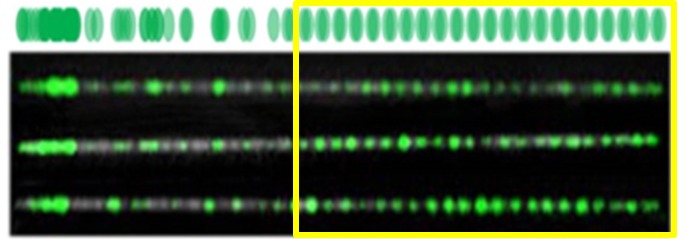
A representative example to demonstrate how M.TaqI-resulted pattern can be used to gain important data: FSHD is the third most common muscular dystrophy. The genetic reason for this disease is a reduction in the number of repeats of a pacific gene called D4Z4, which lies on chromosome 4 and tends to repeat itself in many copies. In the upper part of the picture you can see a reference map, simulating the relative expected locations of labels (highlighted in green) generated by the M.TaqI along part of chromosome 4 containing the pathogenic D4Z4 repeat array. Below it are images of three DNA molecules labelled with M.TaqI, aligned to each other and to the reference map. M.TaqI generates one visible label per each repeat unit, and thus counting the number of equally spaced labels allows quantification of the repeats, and diagnosis of FSHD. The repetitive region (highlighted in yellow) can be distinguished by virtue of the equally spaced labels in the images that match the size of the repetitive gene unit.
Dr Yuval Ebenstein
Principal Investigator
Department of Chemical Physics
School of Chemistry
Tel Aviv University
Tel: +972 3640 8901
Please note: this is a commercial profile


