
María J. Peláez1, Prashant Dogra1, Zhihui Wang1, Vittorio Cristini1 1Mathematics in Medicine Program, Houston Methodist Research Institute, Houston, TX 77030, USA
Dementia is characterized by the deterioration of an individual’s memory and thinking abilities, causing interference in their day-to-day activities. As reported by the World Health Organization (WHO), ~50 million people worldwide are living with dementia, with an additional ~10 million new cases reported every year.1 According to the 2019 Alzheimer’s Disease Facts and Figures report, 60 to 80% cases of dementia are accounted for by Alzheimer’s disease (AD), making AD the most common cause of dementia.2 AD is a progressive brain disorder, which affects intellectual faculties and leads to an inability to perform routine tasks. Alarmingly, between 2000 and 2017, deaths caused by AD increased by 145%, and thus AD ranks as the sixth leading cause of death in the United States.2
AD is a chronic, neurodegenerative disorder characterized by brain tissue shrinkage due to synaptic loss caused by the formation of amyloid plaques and neurofibrillary tangles in the brain tissue. Plaques and tangles are the histopathological hallmarks of AD caused by the extracellular accumulation of amyloid-β peptide (Aβ) and intraneuronal accumulation of hyperphosphorylated tau proteins, respectively.3 These plaques and tangles start to form several years before the appearance of cognitive symptoms. The temporal progression to clinically diagnosable AD occurs on a spectrum, which can be divided into three stages: i) preclinical AD, ii) mild cognitive impairment (MCI) due to AD, and iii) AD dementia.4 The preclinical stage is asymptomatic but is characterized by a subtle decline in cognitive function that is greater than that expected from normal aging; the middle stage is symptomatic but is pre-dementia, and is characterized by mild cognitive symptoms that do not significantly affect everyday living; finally, the third stage is marked by severe cognitive impairment characterized by dementia that impairs the individual’s ability to function independently. The preclinical stage is the longest, and it begins two decades or more before the appearance of clinical MCI and dementia.5 Thus, the preclinical stage offers a window of opportunity to manage disease progression through therapeutic intervention, provided early diagnosis can be established.
However, the mechanisms underlying AD are not fully understood, and the most accepted causal hypothesis is the ‘Amyloid cascade’, which suggests that Aβ is the causative agent of AD and the remaining pathologies are a result of its deposition.6 The distribution of Aβ peptides and tau proteins is believed to undergo ‘prion-like propagation’, such that Aβ peptides and tau proteins propagate from their site of emergence, throughout the cerebral cortex, following a prion-like behavior, supported by experimental findings that show prion-like propagation of Aβ and tau following the seeding of exogenous Aβ7-9 and tau10-12 into the brain.
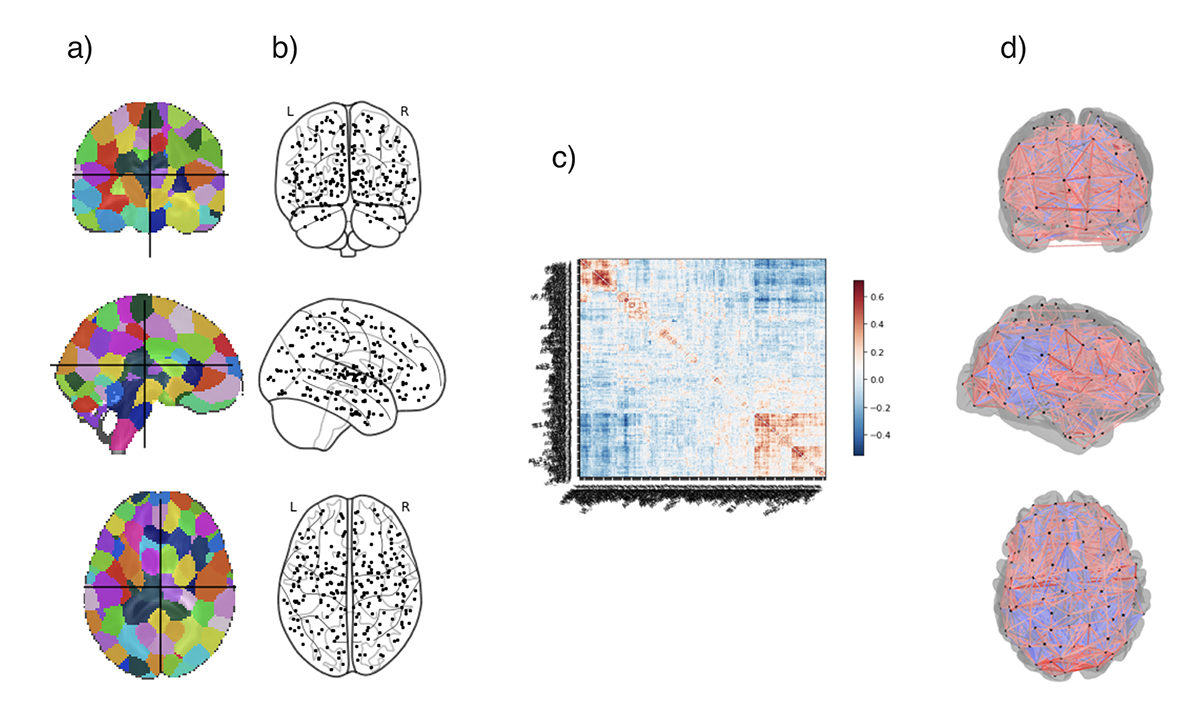
To study the spatiotemporal distribution of Aβ, tau, and synaptic loss13-15, biomarker dynamics16-18, disease progression kinetics19,20, disease prognosis21-23, and therapy efficacy21, mathematical modeling has emerged as a valuable tool. Graph theory based network modeling is a promising tool for investigation of complex brain networks24 and is ideal to study the underlying mechanisms of progression of AD. Most network models are comprised of nodes that represent the cortical or subcortical gray matter structures, and edges that represent the connections between different nodes. Fig. 1 shows a scheme to create a brain network.
To this end, Brier, M. R. et.al. focused on studying the changes in graph theory metrics at different AD stages.25 Specifically, they studied four common metrics: path length, clustering coefficient, modularity, and nodal hub measures. Path length represents a measure of node integration, clustering coefficient is associated with node segregation, modularity describes node distinctness, and if a node is considered a hub, it means that the node has an important role in the structure of the network. The results confirm the understanding of AD as a disconnecting syndrome, due to the decrease of clustering coefficient and the loss of hub-like behavior in three important hubs from the anterior cingulate and medial prefrontal cortices as disease progresses.
The model created by Sanz-Arigita, E. et.al. used synchronization likelihood as a measure of functional coupling for the creation of their network.26 They used the clustering coefficient and path length metrics to asses changes in functional connectivity. The loss of long-distance connections observed also support the view of AD as a disconnection syndrome. Moreover, these disconnections can be mainly observed between the frontal lobe and the parietal and occipital cortices, which supports the anterior-posterior disconnection theory.
In the model of Cope, T. E. et.al. the authors investigated the effects of tau burden in brain functional connectivity. They used clinical resting state functional MRI (fMRI) data to create their network model and compared graph metrics in order to understand AD mechanisms. The results support the prion-like propagation by finding a positive correlation between tau burden and weighted degree.14 This means that nodes that showed stronger connections also presented more tau pathology, within and between functional networks. The consequences of tau accumulation involved an increase in direct long-range connections which lower local efficiency.
A diffusion model based on the prion-like hypothesis was created by Raj, A. et.al., which uses the ‘network heat equation’ to predict disease progression patterns.27 The model was used to predict AD atrophy progression patterns from baseline data. They used the hippocampus as the disease seeding location and validated the outcome atrophy patterns with clinical data from the Alzheimer’s Disease Neurodegenerative Initiative (ADNI) database.28
Finally, Peraza, L. et.al. implemented a susceptible-infected model to reproduce AD propagation patterns. They modeled the probability of a node to be infected and the degradation on the network connectivity.20 Using their model, they predicted that the hippocampus was the most likely origin site for AD and that the most discriminative centrality measures were strength and closeness.
As it can be observed from the works discussed here, network models have been used as a tool to understand AD etiology and pathophysiology. Continued efforts in this direction are necessary for early diagnosis and prognosis of AD. To this end, multiscale network models that combine molecular crosstalk between Aβ and tau leading to synaptic damage can provide a more robust in silico tool to test strategies for early diagnostic and therapeutic interventions.
Please note: This is a commercial profile
References
- Organization, W. H. Dementia, <https://www.who.int/news-room/fact-sheets/detail/dementia> (2019).
- 2019 Alzheimer’s disease facts and figures. Alzheimer’s & Dementia 15, 321-387, doi: https://doi.org/10.1016/j.jalz.2019.01.010 (2019).
- Sengupta, U., Nilson, A. N. & Kayed, R. The Role of Amyloid-beta Oligomers in Toxicity, Propagation, and Immunotherapy. EBioMedicine 6, 42-49, doi:10.1016/j.ebiom.2016.03.035 (2016).
- Sperling, R. A. et al. Toward defining the preclinical stages of Alzheimer’s disease: recommendations from the National Institute on Aging-Alzheimer’s Association workgroups on diagnostic guidelines for Alzheimer’s disease. Alzheimers Dement 7, 280-292, doi:10.1016/j.jalz.2011.03.003 (2011).
- Jack, C. R., Jr. & Holtzman, D. M. Biomarker modeling of Alzheimer’s disease. Neuron 80, 1347-1358, doi:10.1016/j.neuron.2013.12.003 (2013).
- Du, X., Wang, X. & Geng, M. Alzheimer’s disease hypothesis and related therapies. Transl Neurodegener 7, 2, doi:10.1186/s40035-018-0107-y (2018).
- Stöhr, J. et al. Purified and synthetic Alzheimer’s amyloid beta (Aβ) prions. Proceedings of the National Academy of Sciences 109, 11025, doi:10.1073/pnas.1206555109 (2012).
- Hamaguchi, T. et al. The presence of Abeta seeds, and not age per se, is critical to the initiation of Abeta deposition in the brain. Acta Neuropathol 123, 31-37, doi:10.1007/s00401-011-0912-1 (2012).
- Morales, R., Duran-Aniotz, C., Castilla, J., Estrada, L. D. & Soto, C. De novo induction of amyloid-β deposition in vivo. Molecular Psychiatry 17, 1347, doi:10.1038/mp.2011.120 https://www.nature.com/articles/mp2011120#supplementary-information (2011).
- Wu, J. W. et al. Neuronal activity enhances tau propagation and tau pathology in vivo. Nature Neuroscience 19, 1085, doi:10.1038/nn.4328 https://www.nature.com/articles/nn.4328#supplementary-information (2016).
- Polanco, J. C., Scicluna, B. J., Hill, A. F. & Gotz, J. Extracellular Vesicles Isolated from the Brains of rTg4510 Mice Seed Tau Protein Aggregation in a Threshold-dependent Manner. J Biol Chem 291, 12445-12466, doi:10.1074/jbc.M115.709485 (2016).
- Peeraer, E. et al. Intracerebral injection of preformed synthetic tau fibrils initiates widespread tauopathy and neuronal loss in the brains of tau transgenic mice. Neurobiol Dis 73, 83-95, doi:10.1016/j.nbd.2014.08.032 (2015).
- Raj, A., Kuceyeski, A. & Weiner, M. A network diffusion model of disease progression in dementia. Neuron 73, 1204-1215, doi:10.1016/j.neuron.2011.12.040 (2012).
- Cope, T. E. et al. Tau burden and the functional connectome in Alzheimer’s disease and progressive supranuclear palsy. Brain 141, 550-567, doi:10.1093/brain/awx347 (2018).
- Weickenmeier, J., Jucker, M., Goriely, A. & Kuhl, E. A physics-based model explains the prion-like features of neurodegeneration in Alzheimer’s disease, Parkinson’s disease, and amyotrophic lateral sclerosis. Journal of the Mechanics and Physics of Solids 124, 264-281, doi:https://doi.org/10.1016/j.jmps.2018.10.013 (2019).
- Young, A. L. et al. A data-driven model of biomarker changes in sporadic Alzheimer’s disease. Brain 137, 2564-2577, doi:10.1093/brain/awu176 (2014).
- Jedynak, B. M., Liu, B., Lang, A., Gel, Y. & Prince, J. L. A computational method for computing an Alzheimer’s disease progression score; experiments and validation with the ADNI data set. Neurobiol Aging 36 Suppl 1, S178-184, doi:10.1016/j.neurobiolaging.2014.03.043 (2015).
- Caroli, A. & Frisoni, G. B. The dynamics of Alzheimer’s disease biomarkers in the Alzheimer’s Disease Neuroimaging Initiative cohort. Neurobiology of Aging 31, 1263-1274, doi:https://doi.org/10.1016/j.neurobiolaging.2010.04.024 (2010).
- Kashyap, G. et al. Synapse loss and progress of Alzheimer’s disease -A network model. Scientific Reports 9, 6555, doi:10.1038/s41598-019-43076-y (2019).
- Peraza, L. R. et al. Structural connectivity centrality changes mark the path toward Alzheimer’s disease. Alzheimer’s & Dementia: Diagnosis, Assessment & Disease Monitoring 11, 98-107, doi:https://doi.org/10.1016/j.dadm.2018.12.004 (2019).
- Hao, W. & Friedman, A. Mathematical model on Alzheimer’s disease. BMC Systems Biology 10, 108, doi:10.1186/s12918-016-0348-2 (2016).
- Jack, C. R., Jr. et al. Transition rates between amyloid and neurodegeneration biomarker states and to dementia: a population-based, longitudinal cohort study. The Lancet Neurology 15, 56-64, doi:10.1016/S1474-4422(15)00323-3 (2016).
- Wang, T., Qiu, R. G. & Yu, M. Predictive Modeling of the Progression of Alzheimer’s Disease with Recurrent Neural Networks. Scientific Reports 8, 9161, doi:10.1038/s41598-018-27337-w (2018).
- Si, S. Z., Liu, X., Wang, J. F., Wang, B. & Zhao, H. Brain networks modeling for studying the mechanism underlying the development of Alzheimer’s disease. Neural Regen Res 14, 1805-1813, doi:10.4103/1673-5374.257538 (2019).
- Brier, M. R. et al. Functional connectivity and graph theory in preclinical Alzheimer’s disease. Neurobiol Aging 35, 757-768, doi:10.1016/j.neurobiolaging.2013.10.081 (2014).
- Sanz-Arigita, E. J. et al. Loss of ‘small-world’ networks in Alzheimer’s disease: graph analysis of FMRI resting-state functional connectivity. PLoS One 5, e13788, doi:10.1371/journal.pone.0013788 (2010).
- Newman, M. E. J. Networks: An Introduction. (Oxford University Press, 2010).
- Raj, A. et al. Network Diffusion Model of Progression Predicts Longitudinal Patterns of Atrophy and Metabolism in Alzheimer’s Disease. Cell Rep 10, 359-369, doi:10.1016/j.celrep.2014.12.034 (2015).


