
The Global Food Research Program, University of North Carolina in the U.S. share their perspective on how taxes on sugary beverages are important components of noncommunicable disease (NCDs) and obesity prevention strategies
The global food research program has focused its energies on working with governments and research partners globally, especially in low-and middle-income countries, to develop large-scale regulatory and fiscal policies to attempt to prevent obesity and many diet-related NCDs.
- Obesity and other nutrition-related noncommunicable diseases (NCDs), such as type 2 diabetes, hypertension, heart disease, and cancer, are the leading causes of death and disability worldwide. In 2015 more than 2.2 billion people, or one-third of the world’s population, were overweight or obese, and the prevalence is increasing rapidly.1-3
- Consumption of sugary drinks is increasing globally.4, 5
- Similarly, ultra-processed foods have become a major growth component in all countries and represent a huge threat to health and welfare6-8.
Consumption of Sugary Drinks Is a Major Cause of Obesity
- Excessive sugar consumption is a major cause of obesity and its related diseases, increasing the risks of type 2 diabetes, hypertension, liver and kidney damage, heart disease, and some cancers.9-13 The guidelines of the World Health Organization and the World Cancer Research Fund state that added sugars should constitute no more than 10% of an individual’s total calorie intake and preferably less than 5%.9, 10
- Sugary drinks often have no nutritional value and are particularly harmful to the body. The liver absorbs sugar in liquid form more quickly than in solid form and therefore cannot efficiently process and release it. The excess is stored in the liver as fat or glycogen deposits.14 This can lead to fatty liver disease and increased risks for diabetes and other NCDs. Consuming sugar in liquid form, be it from 100% fruit juice or from sugar-sweetened beverages, does not reduce food intake.
- Sugary drinks contribute to undernutrition when they replace foods or drinks with greater micronutrient densities. For example, in some Asian, African, Latin American, and Caribbean countries many infants consume sugary drinks as weaning foods, which can worsen undernutrition and stunting.15-21 Infants with stunting face a much greater risk of high visceral fatness, hypertension, and type 2 diabetes.18, 22-26
- It is hard to offset sugary beverage consumption with physical activity. For instance, to offset consumption of an 8-ounce (oz) (237-milliliter [ml]) regular soft drink requires 16 minutes of running or 1.0 mile of walking.27 To offset the normal intake of 20 oz (591 ml) requires 40 minutes of running or 2.5 miles of walking.
The Solution: Tax Sugary Drinks
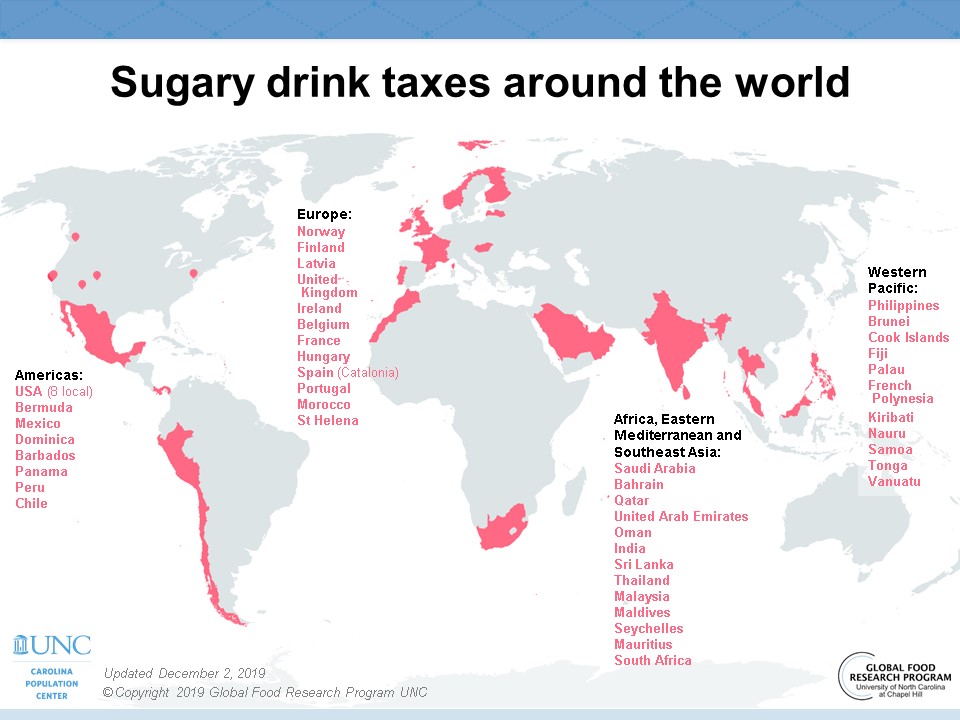
- Sugary drink taxes are win-win decisions for governments, because such taxes reduce sugary drink consumption while increasing revenues to fund other government services and initiatives.28 By 2020, over 45 countries and several smaller geographic units(cities, urban regions), tax sugar-sweetened beverages. (see map).
- Sugary drink taxes increase public awareness of the harms of such drinks and incentivizes the food industry to reformulate products and market healthier beverages.29-31
- In addition to the health-related economic and human costs of sugary drink consumption, the production of sugary drinks has important environmental consequences, particularly in water use and carbon emissions. The total water life cycle cost of the production of half a liter (500 ml or 17 oz) of a regular soft drink ranges from 168 liters of water for sugar beets to 309 liters for sugarcane.32-34 This water footprint includes caffeine and vanilla extract, which account for about 120 liters of water. In the United Kingdom the associated carbon emissions amount to about 0.26% of all of the country’s emissions, mainly from packaging (59.00–87.00%),35 refrigeration (33.00%), and transportation (7.00%).
Over 45 Countries or Smaller Jurisdictions Tax Sugary Drinks
- Prior to the introduction of its sugary drink tax in 2014, Mexico had the world’s highest intake of sugary drinks. Its modest tax, 1 peso per liter (around a 10% tax), has effectively reduced consumption and is hailed globally as a successful, positive public health policy.
- After implementing the tax Mexico experienced a significant reduction in sugary drink purchases,36, 37 an increase in water purchases,36 and no change in total employment.38
- Mexico’s tax most significantly reduced sugary drink consumption among lower-income and high-volume consumers, thus achieving health benefits among the 2 groups with the greatest health risks.39 During the tax’s first year sugary drink purchases among the poorest third of the population were reduced by 9%, compared to 6% on average.36 In the tax’s second year, contrary to food industry predictions, per capita sales and purchases of sugary drinks declined further.40 Mexican research shows that after implementation of the tax overall purchases of healthier beverages replaced those of sugary drinks.36 In the first year after implementation overall water purchases increased by about 4%.
- A 10% reduction in sugary drink consumption among Mexican adults by 2022 from the 2013 level would result in 189,300 fewer cases of type 2 diabetes; 20,400 fewer strokes and heart attacks and 18,900 fewer deaths41
- Sugary drink taxes in US cities have shown even larger impacts on purchases. The 10% tax in Berkeley was linked with significant declines after 1 year and a decline of almost 50% after 3 years.42-44 In Philadelphia, a large, lower-income city, a tax of approximately 15% reduced consumption by more than 38% in 1 year.45
- The United Kingdom, Ireland, Saudi Arabia, the United Arab Emirates, India, South Africa, and many other countries and cities have passed taxes of 20% or higher as essential public health strategies.46-50
- Excise taxes have worked for other unhealthy products. Taxes on unhealthy food products in Hungary and Denmark showed similar positive impacts in reducing purchases, as did a tax on nonessential food purchases in Mexico.51-53 Tobacco taxes have played a significant role in reducing tobacco use in jurisdictions around the globe.54
Ultra-processed foods and beverages increase significantly the risks of obesity, and other noncommunicable diseases, and most causes of mortality, while reduced consumption has significant effects on health and well-being.
- Montiero has defined ultra-processed foods as multi-ingredient, industrially formulated mixtures that are hyper-palatable and contain excessive amounts of added sugar, added saturated fats and added sodium along with many additives.55, 56 They are usually manufactured to be ready-to-eat or ready-to-heat requiring no preparation before quick, easy consumption.57, 58
- An increasing number of studies globally find these represent a huge growth component of food consumption in all countries8, 59-63.Case studies in various regions have found a rapid growth in Latin America and sub-Saharan Africa58, 64 Today there is not a town or village globally which does not have quick access to these unhealthy foods and beverages.
- A sophisticated random controlled trial with a cross-over design run by the US National Institutes of Health showed that shifting from a real food diet toward an ultra-processed food one was linked with large and significant increases in body weight and all key biomarkers of major noncommunicable diseases65, 66.
- Over 19 cohort studies that followed up adults and children for 10 years and more, showed a strong positive relation between ultra-processed foods and cardiovascular disease and all-cause mortality.67-70 A large number of studies published earlier reported longitudinal data from children and adults that associated ultra-processed food intake with increased NCD risk.7, 68-82
- The rapid growth in sales of these foods in low- and middle-income countries greatly threatens to increase overweight/obesity and undernutrition, because infants are increasingly fed these products. In addition, studies are beginning to associate ultra-processed foods with reduced length-for-age.19 The A. M. Pries et al. 2019 study is the only one linking infant consumption of any ultra-processed food aside from infant formula, which fits into a different category but is also ultra-processed.19, 20, 83-86
Taxes on ultra-processed foods work
- Studies from Mexico and Hungary highlight the potential for taxes on ultra-processed foods to be equally impactful as SSB taxes52, 87, 88. These taxes impact a much wider category of foods and beverages than just SSB taxes.
- Reducing intake of ultra-processed foods is a major driver behind front-of-the-package warning labels which are a major threat to our health. The Chilean front-of-the package octagonal warning label helped to achieve significant reductions in SSB consumption in the world’s highest per capita consumer of SSB’s and be linked to major reformulation by the food industry89, 90alThis approach reduces not only added sugar consumption but also foods with excessive levels of saturated fats and sodium91
REFERENCES
- Forouzanfar MH, Alexander L, Anderson HR, Bachman VF, Biryukov S, Brauer M, et al. Global, regional, and national comparative risk assessment of 79 behavioural, environmental and occupational, and metabolic risks or clusters of risks in 188 countries, 1990-2013: a systematic analysis for the Global Burden of Disease Study 2013. The Lancet. 2015; 386(10010): 2287-323.
- NCD Risk Factor Collaboration. Trends in adult body-mass index in 200 countries from 1975 to 2014: A pooled analysis of 1698 population-based measurement studies with 19.2 million participants. The Lancet. 2016; 387(10026): 1377-96.
- The GBD Obesity Collaborators. Health Effects of Overweight and Obesity in 195 Countries over 25 Years. New England Journal of Medicine. ,2017; 377(1): 13-27.
- Singh GM, Micha R, Khatibzadeh S, Shi P, Lim S, Andrews KG, et al. Global, Regional, and National Consumption of Sugar-Sweetened Beverages, Fruit Juices, and Milk: A Systematic Assessment of Beverage Intake in 187 Countries. PLoS ONE. 2015; 10(8): e0124845.
- Popkin BM, Hawkes C. Sweetening of the global diet, particularly beverages: patterns, trends, and policy responses. The Lancet Diabetes & Endocrinology. 2016; 4(2): 174-86.
- Popkin BM, Reardon, Tom.,. Obesity and the food system transformation in Latin America. Obesity Reviews. 2018; 19(8): 1028-64.
- Vandevijvere S, Jaacks LM, Monteiro CA, Moubarac JC, Girling‐Butcher M, Lee AC, et al. Global trends in ultraprocessed food and drink product sales and their association with adult body mass index trajectories. Obesity Reviews. 2019.
- Monteiro CA, Moubarac JC, Cannon G, Ng SW, Popkin B. Ultra‐processed products are becoming dominant in the global food system. Obesity Reviews. 2013; 14(Suppl 2): 21-8.
- World Cancer Research Fund International. Curbing global sugar consumption: Effective food policy actions to help promote healthy diets and tackle obesity. London: WCRF; 2015.
- United Nations Development Program, World Health Organization, United Nations Inter-agency Taskforce on the prevention and control of noncommunicable diseases. Barbados NCD Investment case; 2015.
- Malik VS, Hu FB. Sugar-Sweetened Beverages and Cardiometabolic Health: An Update of the Evidence. Nutrients. 2019; 11(8): 1840.
- Malik VS, Li Y, Pan A, De Koning L, Schernhammer E, Willett WC, et al. Long-term consumption of sugar-sweetened and artificially sweetened beverages and risk of mortality in US adults. Circulation. 2019; 139(18): 2113-25.
- World Health Organizaiton. Global Health Observatory (GHO) data: Raised blood pressure,. Global Health Observatory (GHO) data 2019 [cited 2019 November 23]; Available from:
- Malik VS, Hu FB. Fructose and Cardiometabolic Health: What the Evidence From Sugar-Sweetened Beverages Tells Us. Journal of the American College of Cardiology. 2015; 66(14): 1615-24.
- Marriott BM, Campbell L, Hirsch E, Wilson D. Preliminary data from demographic and health surveys on infant feeding in 20 developing countries. The Journal of nutrition. 2007; 137(2): 518S-23S.
- Zehner E. Promotion and consumption of breastmilk substitutes and infant foods in Cambodia, Nepal, Senegal and Tanzania. Maternal & child nutrition. 2016; 12(S2): 3-7.
- Jaacks LM, Kavle J, Perry A, Nyaku A. Programming maternal and child overweight and obesity in the context of undernutrition: current evidence and key considerations for low- and middle-income countries. Public health nutrition. 2017; 20(7): 1286-96.
- Audain K, Levy L, Ellahi B. Sugar-sweetened beverage consumption in the early years and implications for type-2 diabetes: a sub-Saharan Africa context. Proceedings of the Nutrition Society. 2019: 1-7.
- Pries AM, Rehman AM, Filteau S, Sharma N, Upadhyay A, Ferguson EL. Unhealthy Snack Food and Beverage Consumption Is Associated with Lower Dietary Adequacy and Length-for-Age z-Scores among 12–23-Month-Olds in Kathmandu Valley, Nepal. The Journal of Nutrition. 2019.
- Pries AM, Filteau S, Ferguson EL. Snack food and beverage consumption and young child nutrition in low- and middle-income countries: A systematic review. Maternal & Child Nutrition. 2019; 15(S4): e12729.
- Nordhagen S, Pries AM, Dissieka R. Commercial Snack Food and Beverage Consumption Prevalence among Children 6–59 Months in West Africa. Nutrients. 2019; 11(11): 2715.
- Adair LS, Fall CH, Osmond C, Stein AD, Martorell R, Ramirez-Zea M, et al. Associations of linear growth and relative weight gain during early life with adult health and human capital in countries of low and middle income: findings from five birth cohort studies. Lancet. 2013; 382(9891): 525-34.
- Stein AD, Wang M, Martorell R, Norris SA, Adair LS, Bas I, et al. Growth patterns in early childhood and final attained stature: data from five birth cohorts from low- and middle-income countries. Am J Hum Biol. 2010; 22(3): 353-9.
- Martorell R, Horta BL, Adair LS, Stein AD, Richter L, Fall CH, et al. Weight gain in the first two years of life is an important predictor of schooling outcomes in pooled analyses from five birth cohorts from low- and middle-income countries. J Nutr. 2010; 140(2): 348-54.
- Adair LS, Martorell R, Stein AD, Hallal PC, Sachdev HS, Prabhakaran D, et al. Size at birth, weight gain in infancy and childhood, and adult blood pressure in 5 low- and middle-income-country cohorts: when does weight gain matter? Am J Clin Nutr. 2009; 89(5): 1383-92.
- Wells JC, Ana Lydia Sawaya, Rasmus Wibaek , Martha Mwangome, Marios S Poullas, Ranjan Yajnik, Alessandro Demaio. The double burden of malnutrition: etiological pathways and consequences for health. Lancet. 2019(dec publication),.
- Heyward VH, Gibson A. Advanced fitness assessment and exercise prescription 7th edition. Champaign Illinois: Human kineticsPublishing; 2014.
- Brownell KD, Farley T, Willett WC, Popkin BM, Chaloupka FJ, Thompson JW, et al. The Public Health and Economic Benefits of Taxing Sugar-Sweetened Beverages. New England Journal of Medicine. 2009; 361(16): 1599-605.
- Donaldson E. Advocating for Sugar-Sweetened Beverage Taxation: A Case Study Of Mexico. Baltimore, Md.: Johns Hopkins Bloomberg School of Public Health; 2015.
- Briggs ADM, Mytton OT, Kehlbacher A, Tiffin R, Elhussein A, Rayner M, et al. Health impact assessment of the UK soft drinks industry levy: a comparative risk assessment modelling study. The Lancet Public Health. 2017; 2(1): e15-e22.
- Roache SA, Gostin LO. The Untapped Power of Soda Taxes: Incentivizing Consumers, Generating Revenue, and Altering Corporate Behavior. International Journal of Health Policy and Management. 2017: -.
- Ercin AE, Aldaya MM, Hoekstra AY. Corporate water footprint accounting and impact assessment: the case of the water footprint of a sugar-containing carbonated beverage. Water Resources Management. 2011; 25(2): 721-41.
- Hoekstra AY, Chapagain, A.K. Water footprints of nations: Water use by people as a function of their consumption pattern Water Resources Management. 2007; 21: 35-48.
- Hoekstra AY. The water footprint of modern consumer society: Routledge; 2013.
- Amienyo D, Gujba H, Stichnothe H, Azapagic A. Life cycle environmental impacts of carbonated soft drinks. The International Journal of Life Cycle Assessment. 2013; 18(1): 77-92.
- Colchero MA, Popkin BM, Rivera JA, Ng SW. Beverage purchases from stores in Mexico under the excise tax on sugar sweetened beverages: observational study. BMJ. 2016; 352.
- Colchero MA, Salgado JC, Unar-Munguía M, Molina M, Ng S, Rivera-Dommarco JA. Changes in prices after an excise tax to sweetened sugar beverages was implemented in Mexico: evidence from urban areas. PLoS ONE. 2015; 10(12): e0144408.
- Guerrero-López CM MM, Juan A. Rivera, Colchero MA.,. Employment changes associated with the implementation of the sugar-sweetened beverage and the nonessential energy dense food taxes in Mexico. In: Mexico NIoPHo, editor. Cuernevaca; 2016.
- Ng SW JR, BM Popkin, MA Colchero. . Did high purchasers respond differently to the excise tax to sugar sweetened beverages in Mexico. Cuernevaca and Chapel Hill: INSP-UNC; 2016.
- Colchero MA, Rivera-Dommarco J, Popkin BM, Ng SW. In Mexico, evidence of sustained consumer response two years after implementing a sugar-sweetened beverage tax. Health Affairs. 2017; 36(3): 564-71.
- Sánchez-Romero LM, Penko J, Coxson PG, Fernández A, Mason A, Moran AE, et al. Projected Impact of Mexico’s Sugar-Sweetened Beverage Tax Policy on Diabetes and Cardiovascular Disease: A Modeling Study. PLOS Medicine. 2016; 13(11): e1002158.
- Falbe J, Thompson HR, Becker CM, Rojas N, McCulloch CE, Madsen KA. Impact of the Berkeley Excise Tax on Sugar-Sweetened Beverage Consumption. American journal of public health. 2016; 106(10): 1865-71.
- Lee MM, Falbe J, Schillinger D, Basu S, McCulloch CE, Madsen KA. Sugar-Sweetened Beverage Consumption 3 Years After the Berkeley, California, Sugar-Sweetened Beverage Tax. American journal of public health. 2019; 109(4): 637-9.
- Silver LD, Ng SW, Ryan-Ibarra S, Taillie LS, Induni M, Miles DR, et al. Changes in prices, sales, consumer spending, and beverage consumption one year after a tax on sugar-sweetened beverages in Berkeley, California, US: A before-and-after study. PLOS Medicine. 2017; 14(4): e1002283.
- Roberto CA, Lawman HG, LeVasseur MT, Mitra N, Peterhans A, Herring B, et al. Association of a beverage tax on sugar-sweetened and artificially sweetened beverages with changes in beverage prices and sales at chain retailers in a large urban setting. Jama. 2019; 321(18): 1799-810.
- Encarnação R, Lloyd-Williams F, Bromley H, Capewell S. Obesity prevention strategies: could food or soda taxes improve health? The journal of the Royal College of Physicians of Edinburgh. 2016; 46(1): 32-8.
- Briggs ADM, Mytton OT, Kehlbacher A, Tiffin R, Rayner M, Scarborough P. Overall and income specific effect on prevalence of overweight and obesity of 20% sugar sweetened drink tax in UK: econometric and comparative risk assessment modelling study. BMJ. 2013; 347.
- Boseley S. Doctors demand a 20% tax on sugary drinks to fight UK obesity epidemic The Guardian. 2015.
- Manyema M, Veerman LJ, Chola L, Tugendhaft A, Sartorius B, Labadarios D, et al. The potential impact of a 20% tax on sugar-sweetened beverages on obesity in South African adults: A mathematical model. PloS one. 2014; 9(8): e105287.
- Donnelly L. Gordhan announces sugar tax. Mail & Guardian. 2016.
- Jensen JD, Smed S. The Danish tax on saturated fat – Short run effects on consumption, substitution patterns and consumer prices of fats. Food Policy. 2013; 42(0): 18-31.
- Bíró A. Did the junk food tax make the Hungarians eat healthier? Food Policy. 2015; 54: 107-15.
- Batis C, Rivera JA, Popkin BM, Taillie LS. First-Year Evaluation of Mexico’s Tax on Nonessential Energy-Dense Foods: An Observational Study. PLoS Med. 2016; 13(7): e1002057.
- Jha P, Peto R. Global Effects of Smoking, of Quitting, and of Taxing Tobacco. New England Journal of Medicine. 2014; 370(1): 60-8.
- Shewfelt RL. Introducing food science. Boca Raton: CRC Press; 2009.
- Monteiro CA, Cannon G, Moubarac J-C, Levy RB, Louzada MLC, Jaime PC. The UN Decade of Nutrition, the NOVA food classification and the trouble with ultra-processing. Public Health Nutrition. 2017; 21(1): 5-17.
- Harris JM, Shiptsova R. Consumer demand for convenience foods: Demographics and expenditures. J Food Distrib Res. 2007; 38(3): 22.
- Poti JM, Mendez MA, Ng SW, Popkin BM. Is the degree of food processing and convenience linked with the nutritional quality of foods purchased by US households? American Journal of Clinical Nutrition. 2015; 99(1): 162-71.
- Cediel G, Reyes M, da Costa Louzada ML, Martinez Steele E, Monteiro CA, Corvalán C, et al. Ultra-processed foods and added sugars in the Chilean diet (2010). Public Health Nutrition. 2017; 21(1): 125-33.
- Steele EM, Baraldi LG, da Costa Louzada ML, Moubarac J-C, Mozaffarian D, Monteiro CA. Ultra-processed foods and added sugars in the US diet: evidence from a nationally representative cross-sectional study. BMJ open. 2016; 6(3): e009892.
- Moubarac J-C, Batal M, Martins APB, Claro R, Levy RB, Cannon G, et al. Processed and ultra-processed food products: consumption trends in Canada from 1938 to 2011. Canadian Journal of Dietetic Practice and Research. 2014; 75(1): 15-21.
- Canella DS, Levy RB, Martins AP, Claro RM, Moubarac JC, Baraldi LG, et al. Ultra-processed food products and obesity in Brazilian households (2008-2009). PLoS One. 2014; 9(3): e92752.
- Monteiro CA, Levy RB, Claro RM, de Castro IR, Cannon G. Increasing consumption of ultra-processed foods and likely impact on human health: evidence from Brazil. Public Health Nutr. 2011; 14(1): 5-13.
- Reardon T, Dave Tschirley, Saweda Liverpool-Tasie, Jessica Fanzo,Michael Dolislager, Christine Sauer, Rahul Dhar, Carolina Vargas,Barry M Popkin. The Food System Transformation and Its Association with the Underweight and Overweight and Obesity Burden in Sub-Saharan Africa In: University MS, editor.; 2019.
- Hall KD. Ultra-processed diets cause excess calorie intake and weight gain: A one-month inpatient randomized controlled trial of ad libitum food intake. Cell Matabolism. 2019 30: 1-10.
- Popkin BM. Ultra-processed foods’ impacts on health. 2030 – Food, Agriculture and rural development in Latin America and the Caribbean. Santiago, Chile: Food and Agriculture Organization of the United Nations; 2019. p. 22.
- Lawrence MA, Baker PI. Ultra-processed food and adverse health outcomes. BMJ. 2019; 365: l2289.
- Rico-Campà A, Martínez-González MA, Alvarez-Alvarez I, de Deus Mendonça R, de la Fuente-Arrillaga C, Gómez-Donoso C, et al. Association between consumption of ultra-processed foods and all cause mortality: SUN prospective cohort study. bmj. 2019; 365: l1949.
- Srour B, Fezeu LK, Kesse-Guyot E, Allès B, Méjean C, Andrianasolo RM, et al. Ultra-processed food intake and risk of cardiovascular disease: prospective cohort study (NutriNet-Santé). bmj. 2019; 365: l1451.
- Fiolet T, Srour B, Sellem L, Kesse-Guyot E, Allès B, Méjean C, et al. Consumption of ultra-processed foods and cancer risk: results from NutriNet-Santé prospective cohort. bmj. 2018; 360: k322.
- Rauber F, Campagnolo P, Hoffman DJ, Vitolo MR. Consumption of ultra-processed food products and its effects on children’s lipid profiles: a longitudinal study. Nutrition, Metabolism and Cardiovascular Diseases. 2015; 25(1): 116-22.
- Mendonça RdD, Pimenta AM, Gea A, de la Fuente-Arrillaga C, Martinez-Gonzalez MA, Lopes ACS, et al. Ultraprocessed food consumption and risk of overweight and obesity: the University of Navarra Follow-Up (SUN) cohort study. The American journal of clinical nutrition. 2016; 104(5): 1433-40.
- Adjibade M, Julia C, Allès B, Touvier M, Lemogne C, Srour B, et al. Prospective association between ultra-processed food consumption and incident depressive symptoms in the French NutriNet-Santé cohort. BMC medicine. 2019; 17(1): 78.
- Costa C, Rauber F, Leffa P, Sangalli C, Campagnolo P, Vitolo M. Ultra-processed food consumption and its effects on anthropometric and glucose profile: A longitudinal study during childhood. Nutrition, Metabolism and Cardiovascular Diseases. 2019; 29(2): 177-84.
- Cunha DB, da Costa THM, da Veiga GV, Pereira RA, Sichieri R. Ultra-processed food consumption and adiposity trajectories in a Brazilian cohort of adolescents: ELANA study. Nutrition & diabetes. 2018; 8(1): 28.
- Gómez-Donoso C, Sánchez-Villegas A, Martínez-González MA, Gea A, de Deus Mendonça R, Lahortiga-Ramos F, et al. Ultra-processed food consumption and the incidence of depression in a Mediterranean cohort: The SUN Project. European journal of nutrition. 2019: 1-11.
- Kim H, Hu EA, Rebholz CM. Ultra-processed food intake and mortality in the USA: Results from the Third National Health and Nutrition Examination Survey (NHANES III, 1988–1994). Public health nutrition. 2019; 22(10): 1777-85.
- Mendonça RdD, Lopes ACS, Pimenta AM, Gea A, Martinez-Gonzalez MA, Bes-Rastrollo M. Ultra-processed food consumption and the incidence of hypertension in a Mediterranean cohort: the Seguimiento Universidad de Navarra Project. American journal of hypertension. 2017; 30(4): 358-66.
- Rohatgi KW, Tinius RA, Cade WT, Steele EM, Cahill AG, Parra DC. Relationships between consumption of ultra-processed foods, gestational weight gain and neonatal outcomes in a sample of US pregnant women. PeerJ. 2017; 5: e4091.
- Rauber F, da Costa Louzada ML, Steele E, Millett C, Monteiro CA, Levy RB. Ultra-processed food consumption and chronic non-communicable diseases-related dietary nutrient profile in the UK (2008–2014). Nutrients. 2018; 10(5): 587.
- Sandoval-Insausti H, Blanco-Rojo R, Graciani A, López-García E, Moreno-Franco B, Laclaustra M, et al. Ultra-processed Food Consumption and Incident Frailty: A Prospective Cohort Study of Older Adults. The Journals of Gerontology: Series A. 2019.
- Schnabel L, Kesse-Guyot E, Allès B, Touvier M, Srour B, Hercberg S, et al. Association between ultraprocessed food consumption and risk of mortality among middle-aged adults in France. JAMA internal medicine. 2019; 179(4): 490-8.
- Vitta BS, Benjamin M, Pries AM, Champeny M, Zehner E, Huffman SL. Infant and young child feeding practices among children under 2 years of age and maternal exposure to infant and young child feeding messages and promotions in Dar es Salaam, Tanzania. Maternal & Child Nutrition. 2016; 12: 77-90.
- Pries AM, Huffman SL, Mengkheang K, Kroeun H, Champeny M, Roberts M, et al. High use of commercial food products among infants and young children and promotions for these products in Cambodia. Maternal & Child Nutrition. 2016; 12: 52-63.
- Pries AM, Huffman SL, Adhikary I, Upreti SR, Dhungel S, Champeny M, et al. High consumption of commercial food products among children less than 24 months of age and product promotion in Kathmandu Valley, Nepal. Maternal & Child Nutrition. 2016; 12: 22-37.
- Feeley AB, Ndeye Coly A, Sy Gueye NY, Diop EI, Pries AM, Champeny M, et al. Promotion and consumption of commercially produced foods among children: situation analysis in an urban setting in Senegal. Maternal & child nutrition. 2016; 12: 64-76.
- Taillie LS, Rivera JA, Popkin BM, Batis C. Do high vs. low purchasers respond differently to a nonessential energy-dense food tax? Two-year evaluation of Mexico’s 8% nonessential food tax. Preventive Medicine. 2017; 105(Supplement): S37-S42.
- Batis C, Rivera JA, Popkin BM, Taillie LS. First-year evaluation of Mexico’s tax on nonessential energy-dense foods: an observational study. PLOS Medicine. 2016; 13(7): e1002057.
- Kanter R, Reyes M, Corvalan C, Vandevijvere S, Swinburn B. Anticipatory effects of the implementation of the Chilean Law of Food Labeling and Advertising on food and beverage product reformulation. Obesity Reviews. 2019.
- Corvalan C, Reyes M, Garmendia ML, Uauy R. Structural responses to the obesity and non-communicable diseases epidemic: Update on the Chilean law of food labelling and advertising. Obesity Reviews. 2019; 20(3): 367-74.
- Taillie LS CA, Reyes M, Popkin BM, Corvalan C. . Evaluating the impact of Chile’s front-of-package warning label, marketing, and school food policies on sugar-sweetened beverage purchases: an observational study. . PLOS Medicine(in press). 2020.


