
Ian Carmichaela, Robert J. Woodsb and Anthony S. Seriannic share their expertise on an aspect of chemistry and biochemistry that concerns circular statistics and NMR which reveal sugar conformational equilibria and dynamics
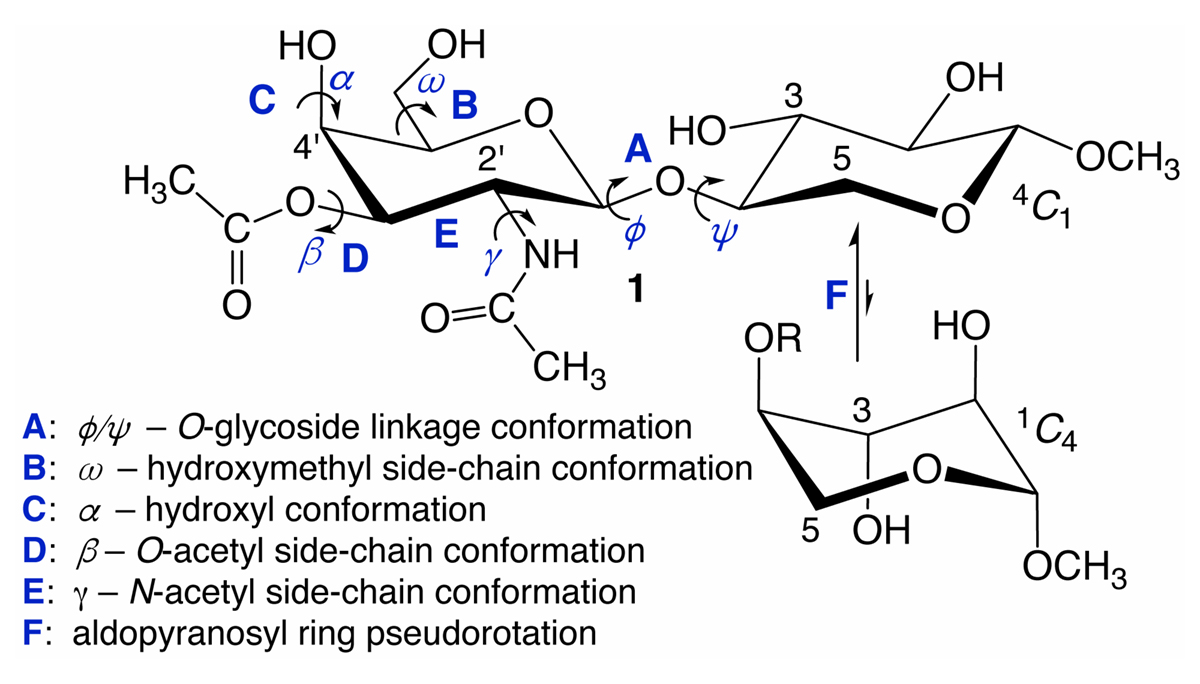
Carbohydrates are talented actors on the biological stage. In addition to their roles in metabolic energy production, they are found on cell surfaces, conjugated to membrane-associated proteins and lipids and as such serve as ligands of extracellular receptors that mediate cellular processes such as cell-cell recognition, bacterial and viral infection, immunity and intracellular trafficking.1 Sugar conformational equilibria and dynamics can be complex in that saccharides contain multiple, flexible elements that collectively determine their overall shapes in solution. The properties of these flexible elements are often correlated and include pyranosyl ring pseudorotation, exocyclic hydroxyl and hydroxymethyl side-chain rotation, N- and O-acetyl side-chain motions and motions about O-glycosidic linkages in oligosaccharides (Figure 1).
For decades, NMR spectroscopy has been used to characterise these solution behaviours by measuring, for example, nuclear Overhauser effects (NOEs), scalar couplings, residual dipolar couplings and nuclear spin relaxation.2 These parameters yield valuable insights into saccharide behaviours but cannot provide, independently, continuous conformational models; their interpretations rely on input from computed energies and/or molecular dynamics (MD) simulations. This dependence is troublesome because (a) saccharide computed energies are error-prone due to the influences of hydroxyl group conformation and/or solvation and (b) saccharide MD simulation models are very difficult to validate experimentally. Current research relies on MD to provide information on saccharide conformation and dynamics in the absence of definitive experimental evidence that MD models provide accurate pictures of solution behaviour.
A new development in the analysis of NMR scalar couplings promises to break the circular arguments and provide independent experiment-based models of saccharide solution behaviour. The technique, known as MA’AT analysis,3-6 yields outputs very similar to those provided by MD, allowing direct superimposition of MA’AT-derived models on those obtained by MD simulations.
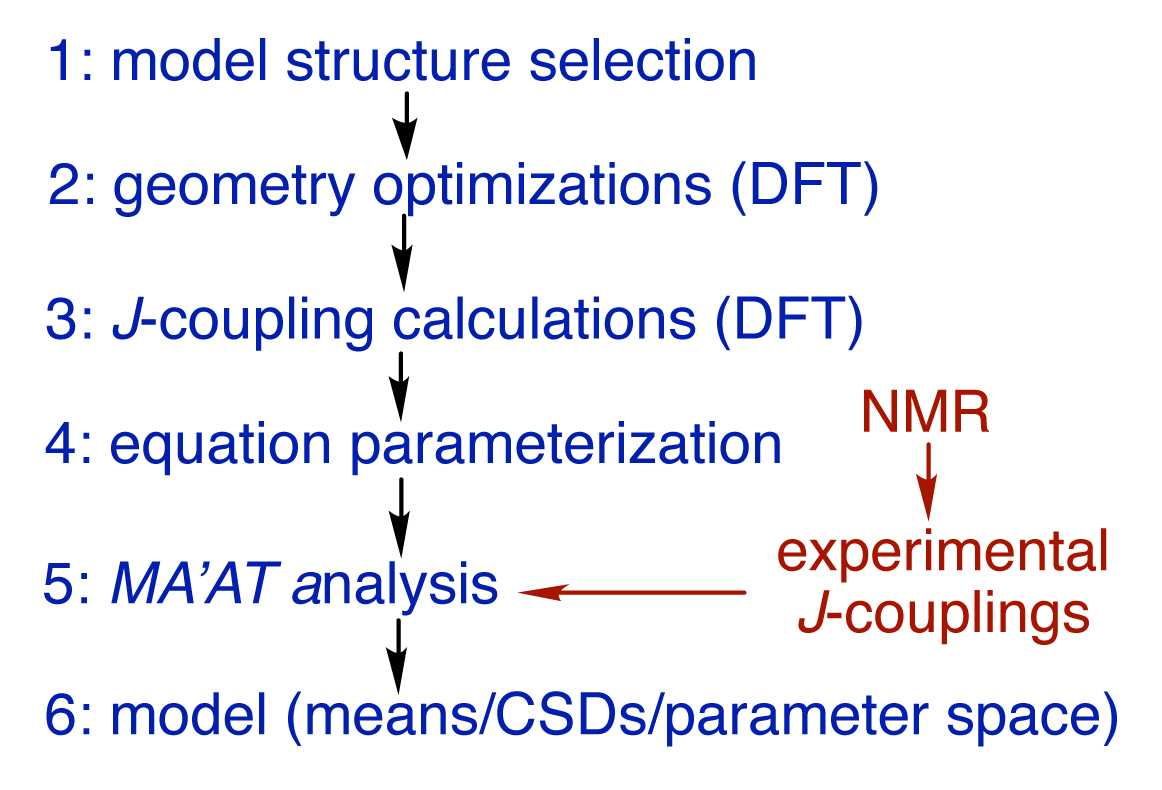
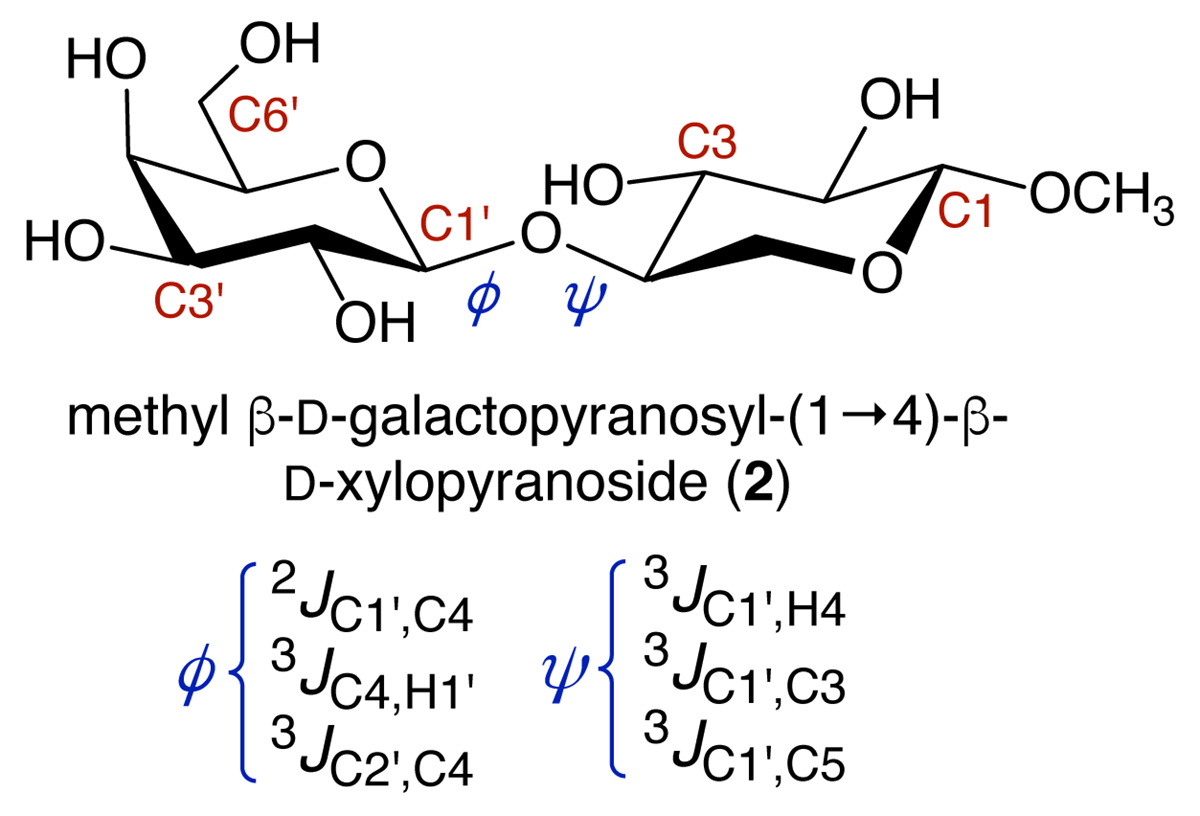
MA’AT analysis involves six steps (Figure 2), illustrated in the modelling of the phi (ф) and psi (ψ) O-glycosidic torsion angles of disaccharide 2 (Figure 3). The structure of 2 is encoded in the z-matrix input to Gaussian.7 Ensembles of redundant J-couplings sensitive to ф and ψ are required and in this case, three J-values are sensitive to each angle (Figure 3). Rotating ф and ψ in the in silico model of 2 through 360° in 15° increments produces 576 conformers and each is geometry optimised using density functional theory (DFT) (Step 2). The six J-couplings are calculated in the 576 conformers (Step 3) and the dependencies are encoded into parameterised equations that generally take the form, Jexp = A + B cos θ + C cos 2θ + D sin θ + E sin 2θ (Step 4). The experimental J-couplings are measured in 2 and the experimental values and parameterised equations are used by the MA’AT program (Step 5), which applies a Monte Carlo search and circular statistics to fit the experimental J-values to conformational models of ф and ψ (Step 6). In this case, only single-state models of ф and ψ pertain due to the small number of observables, but multi-state models can be tested if the number of experimental J-couplings is sufficient (see below). MA’AT outputs include the mean values of ф and ψ and circular standard deviations (CSDs) of these mean values, the latter providing information on the librational character of each torsion angle.
The application of MA’AT to ф and ψ in 2 gives the single-state models shown in Figure 4(C), superimposed on those determined by aqueous MD simulation. The models are in good agreement for ψ, but differ for ф. The sensitivity of the method can be demonstrated by examining βGal-(14)-βGlcOCH3 (3) and βGal-(14)-βAllOCH3 (4) in a similar manner (Figure 4A and B). MA’AT models of ψ in 3 and 4 recapitulate the MD models well, but discrepancies in ф are observed similar to that found for 2.4
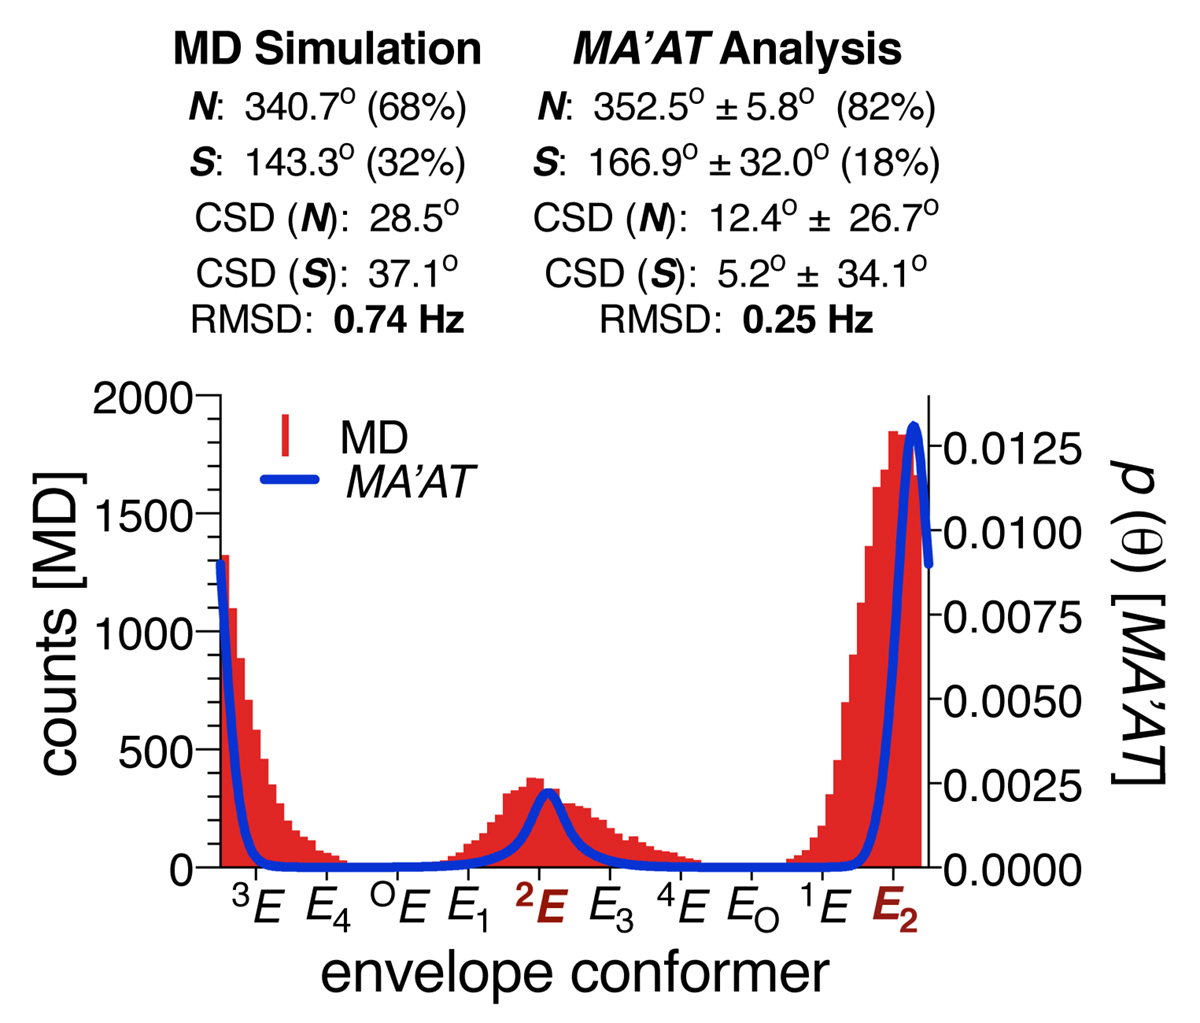
MA’AT analysis can be applied, in principle, to any conformational element in any molecule if multiple, redundant J-values exist, can be measured reliably and can be parameterised. For example, the conformational behaviour of the furanose ring in methyl β-D-ribofuranoside (5) was investigated using nine intra-ring JHH, JCH and JCC values to give a two-state E2/2E pseudorotational model that recapitulates, although not exactly, that obtained by MD simulation (Figure 5).
References
1 Varki, A. Glycobiology 2017, 27, 3–49.
2 Blundell, C. D., Reed, M. A. C., Overduin, M., and Almond, A. Carbohydr. Res. 2006, 341, 1985–1991.
3 Turney, T., Pan, Q., Sernau, L., Carmichael, I., Zhang, W., Wang, X., Woods, R. J., and Serianni, A. S. J. Phys. Chem. 2017, B121, 66–77.
4 Zhang, W., Turney, T., Meredith, R., Pan, Q., Sernau, L., Wang, X., Hu, X., Woods, R. J., Carmichael, I., and Serianni, A. S. J. Phys. Chem. 2017, B121, 3042–3058.
5 Zhang, W., Meredith, R., Pan, Q., Wang, X., Woods, R. J., Carmichael, I., and Serianni, A. S. Biochemistry 2019, 58, 546–560.
6 Zhang, W., Meredith, R., Yoon, M.-K., Wang, X., Woods, R. J., Carmichael, I., and Serianni, A. S. J. Org. Chem. 2019, 84, 1706–1724.
7 Frisch, M. J., Trucks, G. W., Schlegel, et al. Gaussian09, Revision E.01, Gaussian, Inc., Wallingford CT, 2009.
[aRadiation Laboratory and cDepartment of Chemistry and Biochemistry, University of Notre Dame, Notre Dame, IN 46556-5670 USA; bComplex Carbohydrate Research Center, University of Georgia, Athens, GA 30602 USA].
This work was supported by the U.S. National Science Foundation (CHE 1402744 and CHE 1707660).
Please note: This is a commercial profile


