
Professor Robert Aiken, Research Crop Scientist from Northwest Research–Extension Center provides his expert thoughts on the fascinating global research taking place on drought, including the vital role of satellite imagery
As a field agronomist from Northwest Kansas, I’m attending the 15th Ogallala Aquifer Program workshop in Lubbock, TX with irrigation engineers, hydrologists, economists and other water scientists, focused on extending the life of the aquifer to sustain rural economies (https://ogallala.tamu.edu/). The tension in the conference is palpable. “164 days since last measurable precipitation in the Texas High Plains.” “This wheat crop is on the ropes.” “If we don’t get rain soon…”
We all recognise drought. The dull green vegetation; the pallor of dust-filled skies; the dry scratchy throat and persistent cough. Agriculture? Drought stops agriculture in its tracks. Here in the High Plains, agriculture affects a third of the regional economy. In Sub-Saharan Africa, drought affects the core food supply, leading to rural exodus and civil unrest. In Northwest India, drought amplifies the frequency of heat-related deaths. In Cape Town, South Africa, a two-year drought threatens the water supply for the four million residents. Drought touches our lives and communities in myriad ways.
Wayne Palmer published his drought index in 1965, considering drought cycles of the 1930s and 1950s. His metric uses monthly precipitation and atmospheric demand for water, contrived to report the deviation of soil water supply from ‘normal’ conditions. The concept of ‘normal’, or the long-term average weather is central to many drought indices used today. The United States Drought Monitor displays its index using fire colours – yellow, orange, red. Drought metrics provide early warning of impending disasters.
The American Meteorological Society hosted four sessions on drought and food security in its 2018 meetings. One of several global-scale drought monitoring programmes utilises satellite imagery to calculate and map the energy balance for land surfaces. This accounting scheme uses physics to sum inputs and outputs in terms of radiation, evaporation and warming/cooling of air and land. The thermal band from satellites, representing the surface temperature, conveys critical information of surface water availability. Warmer sectors indicate dry surfaces, while the wet regions display cooler temperatures.
Globally, agencies use these techniques to detect and report incipient and ongoing drought. These early warnings and updates inform emergency drought responses. Earth scientists recognise drought as an integral component of the hydrological cycle. The question remains: Has climate change affected the frequency, duration or extent of drought?
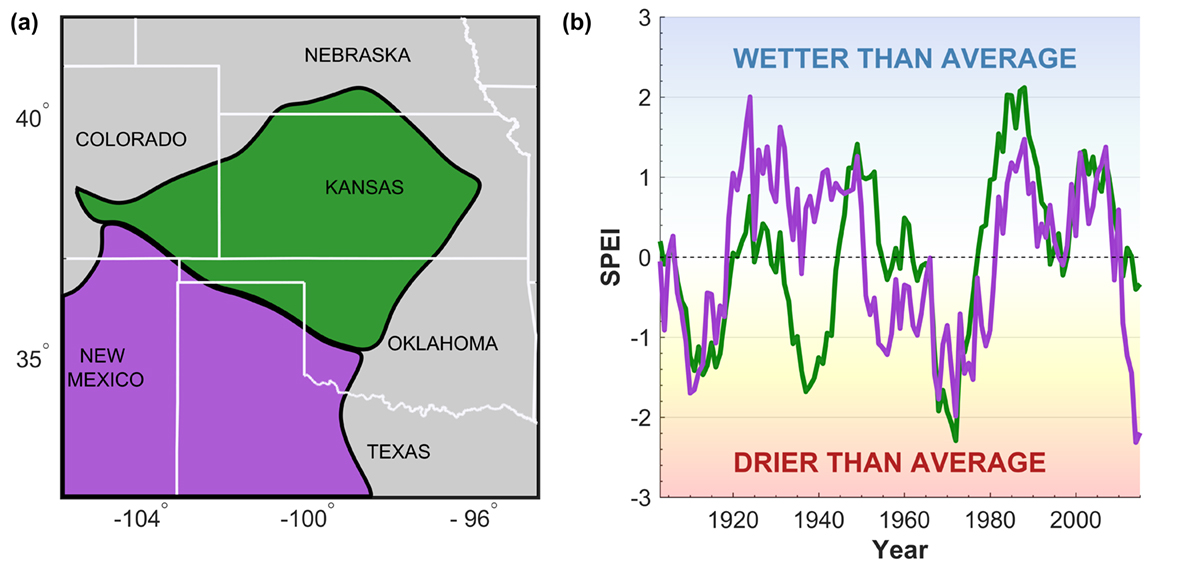
Zach Zambreski, a young, bright, dedicated meteorologist, tackled the problem of long-term drought dynamics in his graduate research (Kansas State University, Agronomy). He employed Empirical Orthogonal Functions (EOF, a type of principal component analysis) to characterise monthly drought metrics of the U.S. Great Plains over the 20th century (1903 to 2015). He then correlated the EOF with each of the localised time series of drought metrics to identify regions with similar historic patterns of wetting and drying cycles. Analyses such as this provide benchmarks against which climate change trends can be usefully compared.
This afternoon our groundwater conference closes. The overnight thunderstorm relieves the tension – for the moment. We muse about La Nina effects, the wet winter conditions in the Northern Great Plains and prospects for wheat harvest. Likely, there are similar conversations within the railroad companies, considering where to position their box cars to transport the wheat crop to export shipping terminals. As earth scientists, we recognise the tools at our disposal to identify and quantify drought. Collectively, as a global society, are we prepared to mitigate the effects of drought?
1 Harris, I., P. D. Jones, T. J. Osborn, and D. H. Lister, 2014: Updated high-resolution grids of monthly climatic observations – the CRU TS3.10 Dataset. International Journal of Climatology, 34, 623-642, doi: 10.1002/joc.3711.
2 Vicente-Serrano, S. M., S. Beguería, and J. I. López-Moreno, 2010: A Multiscalar Drought Index Sensitive to Global Warming: The Standardized Precipitation Evapotranspiration Index. Journal of Climate, 23, 1696-1718, doi: 10.1175/2009jcli2909.1.
Please note: this is a commercial profile
Professor Robert Aiken
Research Crop Scientist
Northwest Research–Extension Center
Tel: +1 785 462 6281


