
Professor Paula Santana from University of Coimbra sheds light on the importance of capturing a holistic understanding of population health
Despite the significant advances that have been made at the European Union (EU) level in terms of health inequality measurement, there is still a lack of comparable indicators able to capture the holistic understanding of population health, with multiple determinants involved. Existing measures and indicators of health status and quality of life are considered inadequate, especially when measurements focus on regional and local levels.
The EURO-HEALTHY project has contributed with a response to this challenge, by applying both a multi- and trans-disciplinary approach and sound methodology to enable the appraisal and comparison of population health and inequalities in multiple dimensions.
Consequently, the project constructed the EURO-HEALTHY Population Health Index (PHI) – a multidimensional and multilevel robust measure – to evaluate and monitor European health as well as the interactions between health in a wide range of areas of concern, dimensions and indicators.
Presenting a bottom-up hierarchical structure, the PHI takes into consideration two main components of population health: health determinants and health outcomes, both disaggregated to areas of concern, dimensions and indicators. The indicators are presented for the following 17 health dimensions: employment, income and living conditions, social protection, security, education, demographic change, lifestyle and health behaviours, pollution, housing conditions, water and sanitation, waste management, road safety, healthcare resources, healthcare expenditure, healthcare performance, mortality, and morbidity.
Analysis
To provide a snapshot of the health of the European population and detect health inequalities, the PHI was applied to 269 NUTS 2 regions of the 28 EU countries. This level of analysis was chosen given that it is the statistical unit applied by the European Structural and Investment Funds (ESIF) to define regional boundaries and to determine geographic eligibility for receiving funding. Regional eligibility provides essential opportunities to address and invest in interventions that tackle health inequalities across NUTS 2 regions.
The PHI ranges from 0 to 100, where 0 represents the lowest value-score of population health and 100 the highest value-score. The findings demonstrate a high degree of variation in the geographical distribution of health determinants and health outcomes, emphasising that inequalities still persist in Europe. The identified inequalities can be understood through the analysis of environmental, social, economic, and lifestyle/ behavioural patterns.
The PHI has uncovered that the spatial distribution of the multiple health determinants of population health is heterogeneous, showing differences between Northern regions and Southern and Eastern Europe regions. Overall, the more developed regions of the Northern countries present value-scores that are significantly higher (Health Determinants index > 80) than those presented by regions in the transition from Southern and Eastern Europe (where lives 167 million people) with worse population health (Health Determinants index < 50). This finding refers to all dimensions of Health Determinants component, except for the security, demographic change and education.
Inequalities in Europe
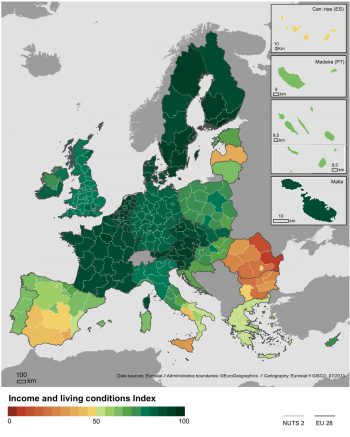
Economic conditions and social protection remain the most important domains for reducing the EU regional health inequalities. Income and living conditions present the largest inequalities (S80/S20): regions within the highest quintile (S80) have 11 times higher income compared with the regions within the lowest quintile (S20) where it lives around 100 million people (Map 1).
In general, Europeans are educated (Education index > 65), showing a positive contribution to overall population health; however, significant differences are observed between the highest value-scores in North-Central Europe, and the lowest value-scores concentrated in Southern European countries.
Different levels of development in the EU regions are presented through built environment indicators. Remarkably, there are still populations in the EU28 that “live in households without flushing toilets”, that is not “connected to public water supply”, and are not “connected to wastewater treatment plants”.
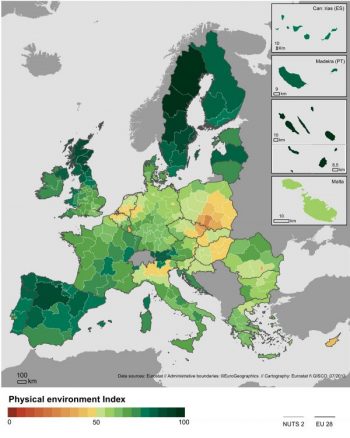
When looking at the within-countries inequality, the 28 EU capital regions present systematically better value-scores when compared with other regions in all health determinants. Nevertheless, capital regions struggle with increased rates of recorded crimes and air pollution. It was found that 50% of these regions registered a PM10 concentration higher than 2005 WHO recommendations (20 ug/m3per capita), and almost 80% exceeded the recommended (10 ug/m3 per capita) concentration of PM2.5. Globally speaking, there are 157 million Europeans who live in regions of particular concern for physical environment indicators and are evaluated with the lowest population health value-scores (Physical Environment index < 50); mainly concentrated in East-Central Europe (Map 2).
Regarding lifestyle dimension, policies and interventions promoting more positive health behaviour changes and lifestyles need to be reinforced across the EU, particularly within the Baltic States and Eastern European countries.
Even though amenable deaths due to healthcare dropped significantly in all EU regions showing an overall good healthcare performance, regional inequalities persist, which indicates noticeable differences between the regions with the highest and lowest values (ratio S80/S20 equals 3).
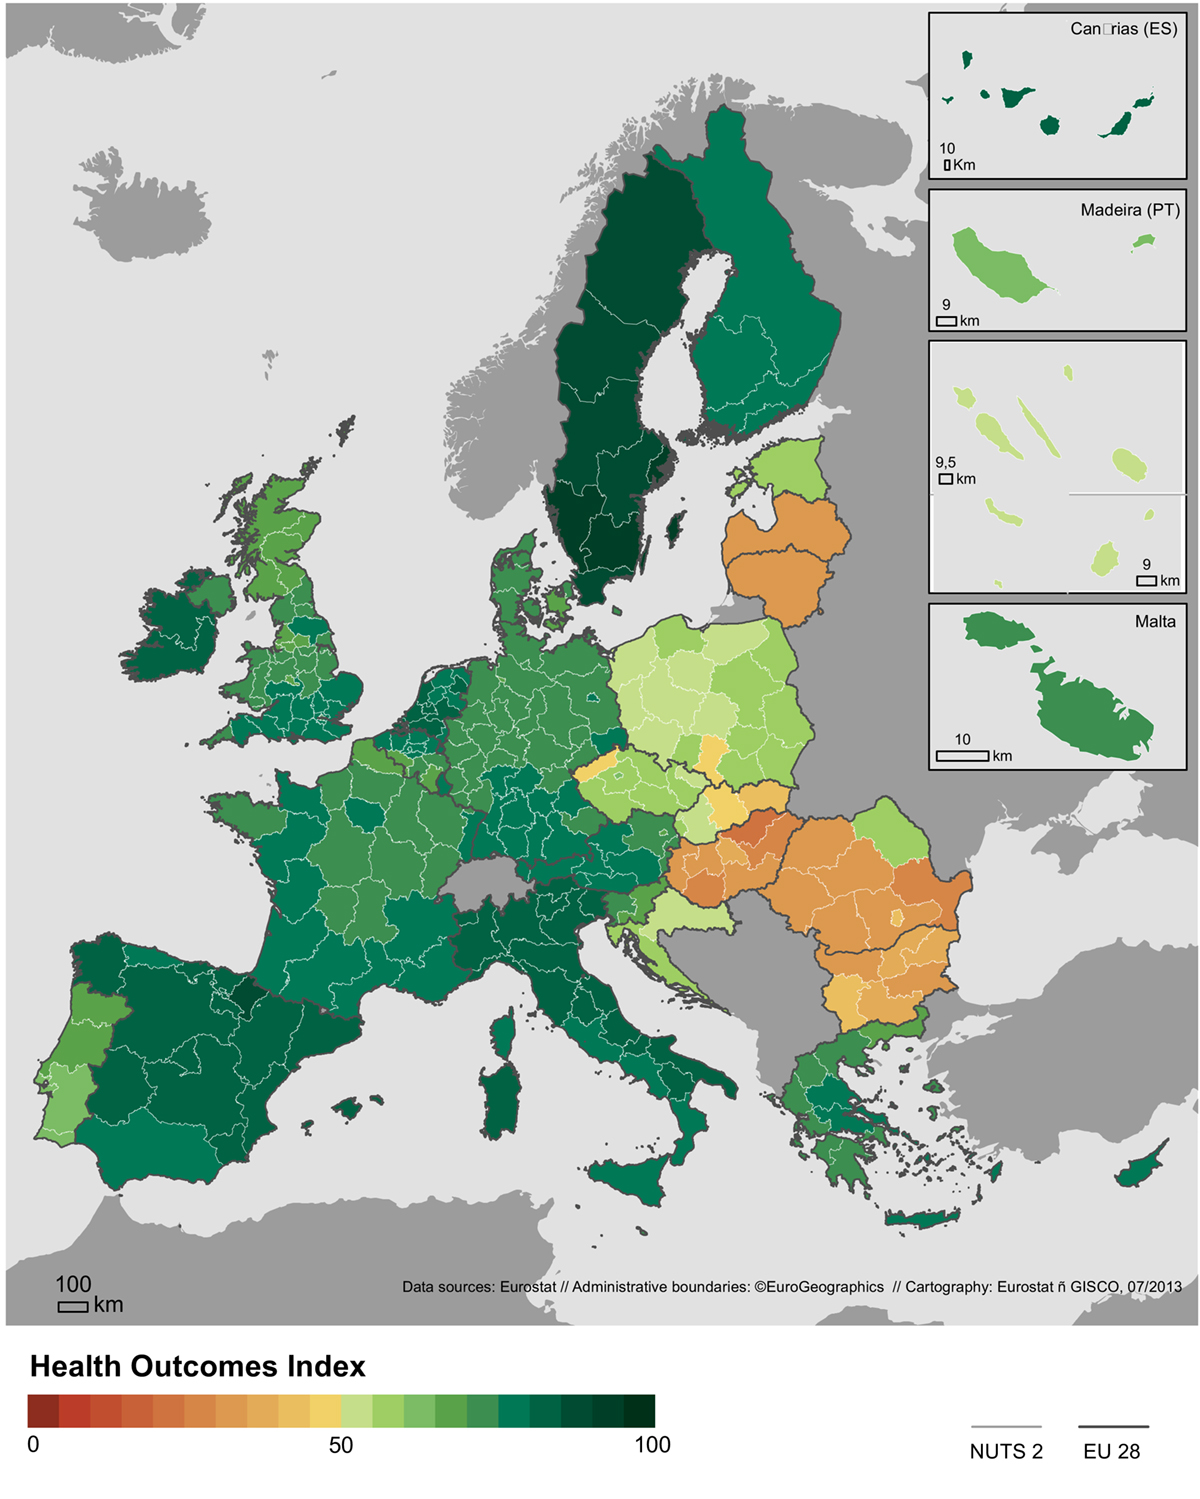
When analysing health outcomes, similarly to health determinants, there are clear differences between high scores (Health Outcomes index >70) observed in the Northern and Western regions of the EU and lower scores recorded in regions where ¾ of the EU population lives, with particularly low value-scores (Health Outcomes index <50) identified in the regions of Eastern Europe (Map 3).
Deaths from causes considered to be “avoidable” remain excessive, particularly in the regions of the Baltic States and Eastern European countries. These regions (where more than 100 million EU inhabitants reside) show significant low value-scores (average Mortality index <37) for population health (measured by preventable mortality, infant mortality and life expectancy at birth) and therefore require particular interventions to decrease observed inequalities. Despite the decline in preventable deaths and infant mortality among all the EU28 regions, chronic conditions have increased, creating an ongoing challenge for healthcare systems.
The space-time analysis and comparison of the PHI are possible through a user-friendly web-based Geographic Information System (GIS) platform on http://healthyregionseurope.uc.pt/ (to be made available to the public without cost by December 2017).
Reference: Santana P, Costa C, Freitas Â, Stefanik I, et al. Atlas of Population Health in European Union Regions. Coimbra, Portugal: Imprensa da Universidade de Coimbra; 2017. doi:10.14195/978-989-26-1463-2.
The sole responsibility for the content of this report lies with the authors. It does not necessarily reflect the opinion of the European Union. The European Commission is not responsible for any use that may be made of the information contained therein.
Please note: this is a commercial profile
Professor Paula Santana
Project Coordinator
University of Coimbra


