
Here, Prof. Dr. Christopher T. Culbertson, Prof. Dr. Stefan H. Bossmann, Jay Sibbitts and Courtney Johnson discuss microfluidic isolation and analysis of cell organelles
Cancers exhibit disrupted normal cellular behaviour that can manifest as abnormal organelle functioning and morphology, resulting in misfolded proteins and changes in gene expression. Specifically, malignant cells can exhibit features such as an enlarged nucleus, irregular mitochondrial volume, and altered expression of membrane receptors.1 The isolation of organelles is paramount for subcellular analysis of these abnormalities, as well as the development of targeted immunotherapies.
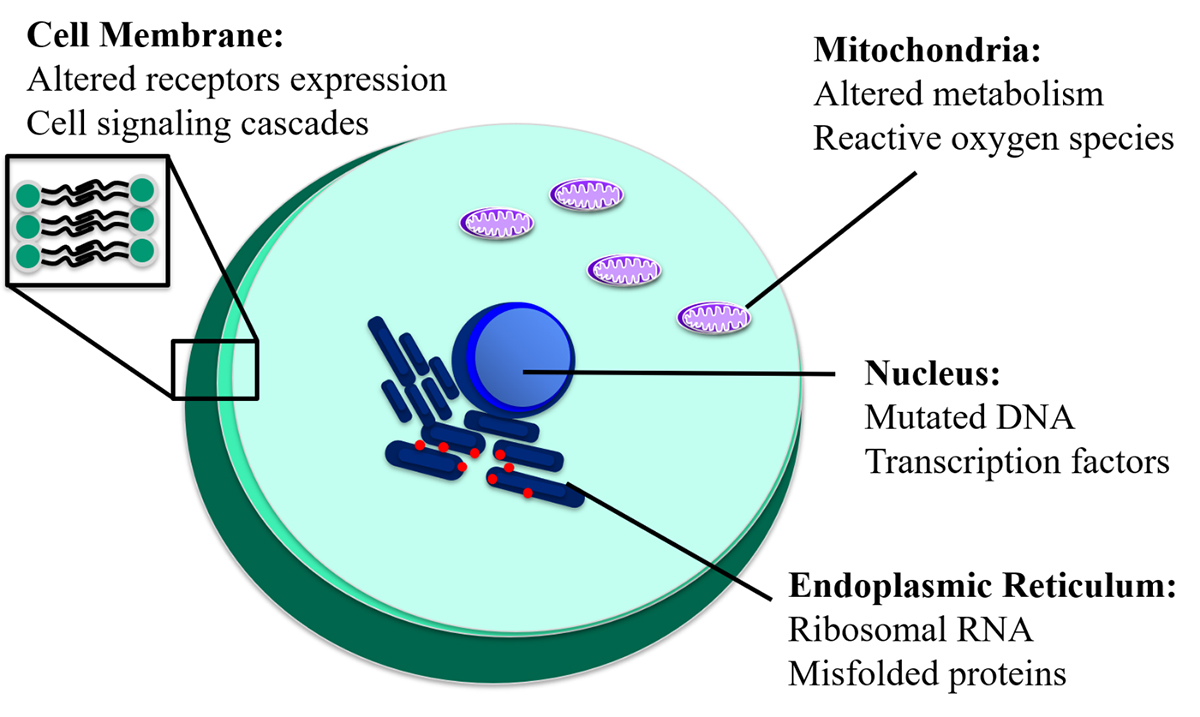
By isolating and examining organelles or proteins of interest, researchers may elucidate unknown functions or responses to chemotherapeutics (Figure 1). Current bulk-organelle purification, handling, and analysis techniques often compromise organelle integrity and yield results reflecting the population average, which does not account for the presence of subpopulations. In contrast, single-cell analysis techniques can be used to identify
and isolate select subpopulations of interest, while limiting damage to organelles.
Traditional methods of organelle isolation are labour intensive and risk damage and contamination to the sample. For example, mechanical homogenisation allows for separation of organelles of interest, but in order to do so, mechanical grinding of cells must occur, leaving the sample vulnerable to contamination from unwanted organelles and organelle fragments. Organelle fractionation, comparatively, employs centrifugation but still exposes the organelles to shear forces which may disrupt the organelle membrane or completely rupture the organelle. Though widely used, these techniques leave much to be desired.2
Alternatively, electrophoresis is a continuous separation technique that groups organelles based on charge and size using an electric field applied across a separation medium. This technique helps to eliminate stresses the sample may experience when mechanical methods of isolation are employed. Electrophoresis is also frequently integrated into single-cell analysis techniques in the field of microfluidics.
The field of microfluidics, or microscale fluid-based analysis, has developed many technologies and strategies geared towards applications in single-cell analysis and handling. We have developed a high-throughput microfluidic device that automatically transports each cell to an electrophoretic separation channel where they are rapidly and electrokinetically lysed and intracellular contents are electrophoretically separated and quantified. The goal of this project is to elucidate the trajectory of organelles in order to adapt the device for future isolation and analysis of in vitro studies while minimally impacting the sample and improving the accuracy of experimental results.
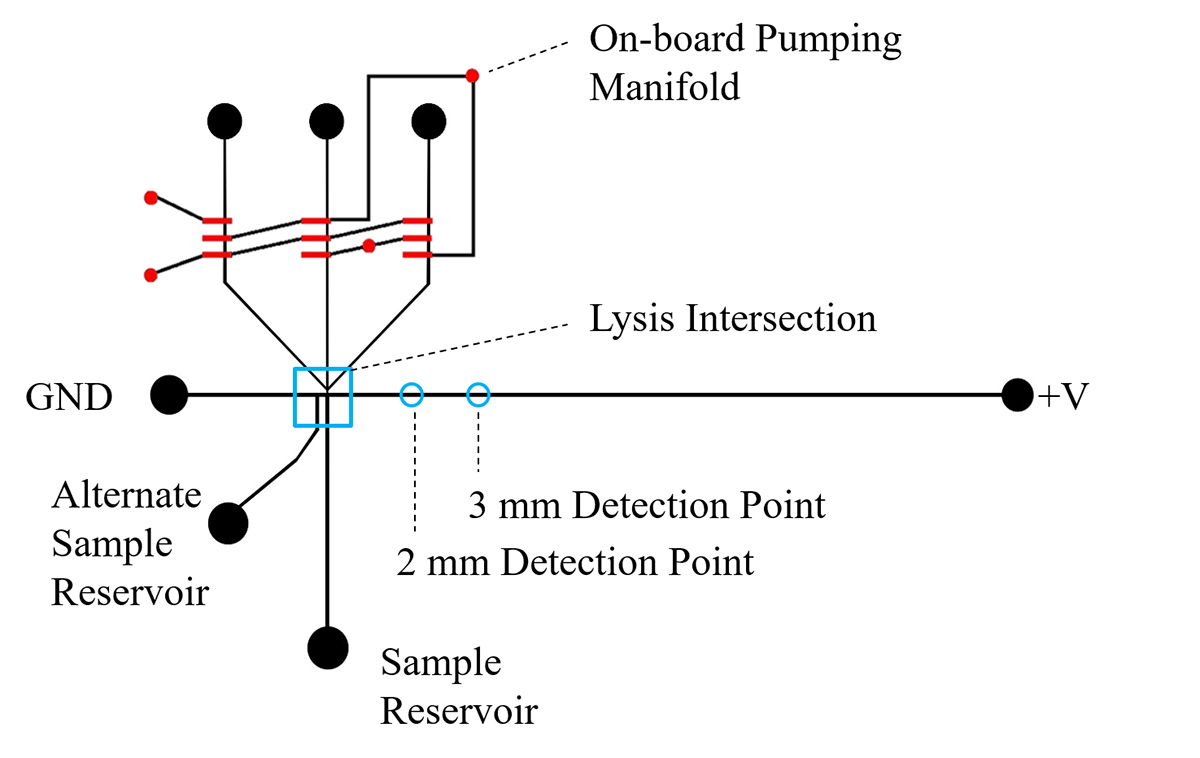
The single-cell analysis device is fabricated using a transparent elastomer, polydimethylsiloxane (PDMS), and soft lithography with photolithographically patterned molds. The device contains an array of valves that function as peristaltic pumps controlled by a low-cost microcontroller that are used to drive hydrodynamic flow transporting cells from the sample reservoir to the lysis intersection (Figure 2). At the junction, cells are exposed to a high electric field that electroporates the membrane, causing permanent disruption and cell lysis. Intracellular contents then travel downstream of the lysis intersection or continue upwards toward the pneumatic pumps where they may be captured for further analysis.
To successfully redesign the device for the purpose of organelle isolation, the trajectory of the organelles needs to be elucidated. Organelles of interest include the mitochondria, nucleus, and cell membrane due to their involvement in metastatic cell development. To track the direction in which the intracellular contents travel following lysis, cells are co-labelled with an organelle-specific dye and the cytosolic fluorescent dye carboxyfluoresceine diacetate (CFDA).
The organelle stain confirms the presence of the subcellular content of interest and the release of the CFDA confirms lysis of the cell. Thus far, two model immortalised cell lines have been examined: non-adherent human T cells (Jurkat) and adherent phagocytic mouse microglial cells (SIM-A9). These cell lines were chosen to be representative of a variety of morphological characteristics, such as cell size, membrane elasticity, and membrane composition.
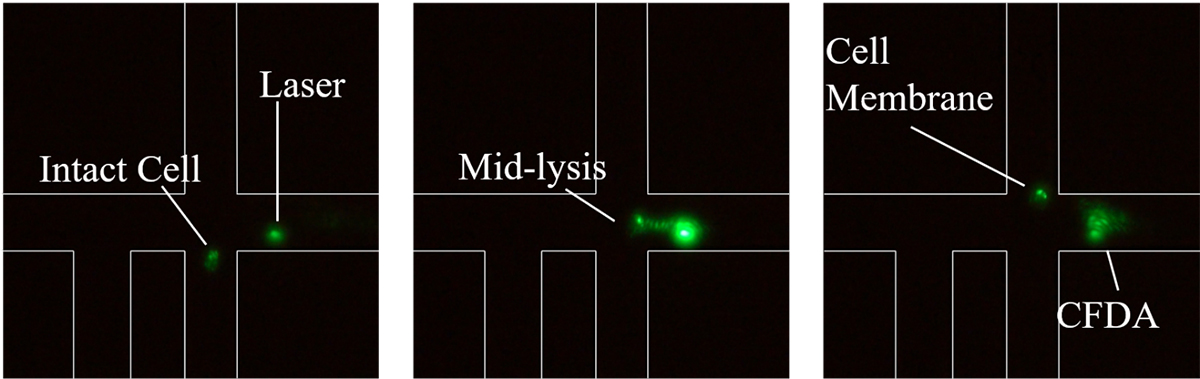
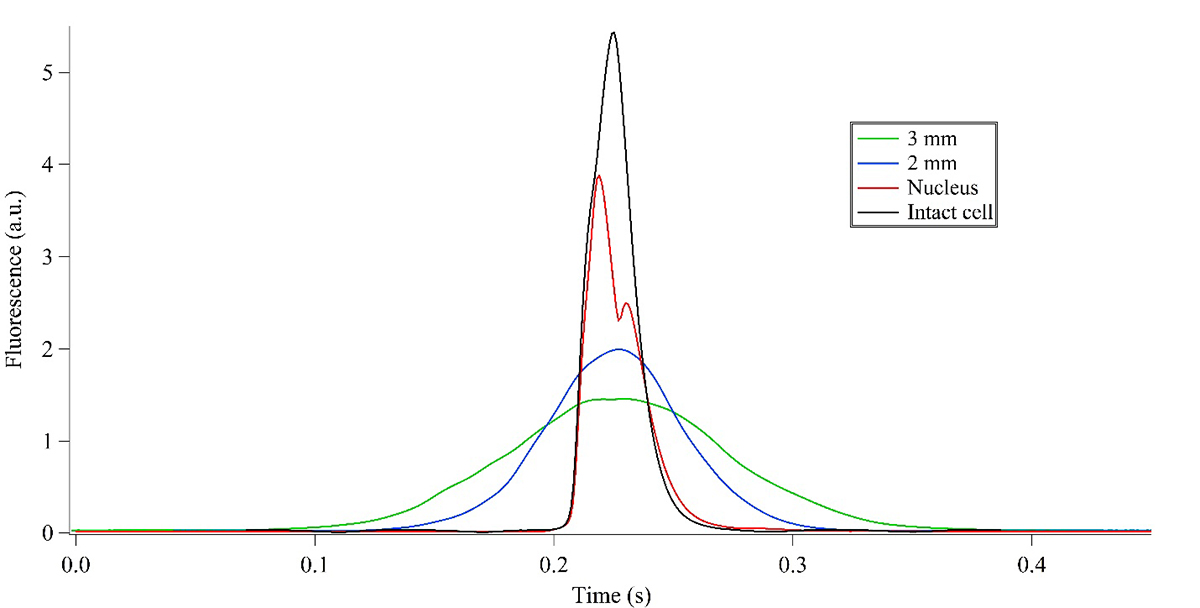
For experimentation, labelled cells are loaded into the device, and as they are lysed, the trajectories of the fluorescent species are determined using an inverted microscope with wide-field excitation and a camera for video capture or laser induced fluorescence detection and a photomultiplier tube when higher sensitivity is required. Multiple detection points around the lysis intersection are monitored on the device during analysis (shown in Figure 3). Intact cell labelling is confirmed below the junction, and lysate is measured at 2 mm and 3 mm distances to the right of the intersection.
Fluorescence peak heights and widths are compared for the 2 and 3 mm detection distances. Band-broadening indicates that the dissolved fluorescent species is present whereas narrow and jagged peaks would correspond to solid organellar material (Figure 4). The final detection point is above the lysis intersection to check if the organelle of interest travels towards the pumps. Analysis of the fluorescence peaks collected at strategic detection locations indicated that while the CFDA went into the separation channel, the cell membrane, mitochondria, and nucleus travelled towards the pumping manifold above the lysis intersection.
Microfluidic single-organelle purification presents a promising alternative to traditional methods as it not only reduces stress and damage to collected organelles but may also allow for the selective isolation of subpopulations of interest for further analysis. In future studies we will adjust buffer composition to tune the electrophoretic and electroosmotic flow to selectively modify the trajectory of organelles. Changes in device design will also be explored by incorporating functional elements that allow for sorting and selection of organelles from subpopulations exhibiting unique characteristics.
1 Baba Al, Câtoi C. Comparative Oncology. Bucharest (RO): The Publishing House of the Romanian Academy; 2007. Chapter 3, Tumor Cell Morphology.
2 Satori, C. P., Kostal, V., & Arriaga, E. A. (2012). Review on recent advances in the analysis of isolated organelles. Analytica chimica acta, 753, 8–18. doi:10.1016/j.aca.2012.09.041
*Please note: This is a commercial profile


