
Prof Robert Aiken, research crop scientist at Northwest Research—Extension Center tells us about his fascinating research into water and temperature, including the extent to which they limit crop productivity
Planting an agricultural crop requires a degree of optimism. In the semi-arid region of Kansas, which I study, water and temperature frequently limit crop productivity. These components of weather, along with sunshine and relative humidity, comprise the weather-related risks which limit the productivity of the crop just planted. As an agricultural scientist, I query the climate scientists: Are there periodic behaviours in weather patterns? Are there long-distance signals indicating wetting and drying trends? Is long-term weather forecasting feasible? If so, accurate forecasts can inform the optimism required to plant that crop, infusing an additional hope that the bet has been hedged.
Seeking information about weather forecasting skill, I learned about ‘teleconnections’ at recent American Meteorological Association meetings. The El Nino-Southern Oscillation (ENSO) phenomena serves as an example. Warming and cooling trends in the surface waters of the equatorial Pacific Ocean impact fisheries and rainfall in coastal Peru. Indeed, ENSO trends impact the productivity of winter wheat growing in the Texas High Plains. Louis Baumhardt, a USDA-ARS soil scientist and his colleagues found a degree of association between ENSO patterns and winter wheat yields in the Texas Panhandle1. Does this ENSO signal convey information about wheat productivity further north, in the central U.S. High Plains?
We know that winter wheat is vulnerable to drought conditions; wheat can also respond positively to wet conditions, though subject to disease impacts2. The Standardized Precipitation-Evapotranspiration Indicator (SPEI) provides a metric for wetting and drying conditions, generally varying between values of -4 and 4 to indicate drying (negative) and wetting (positive) conditions. We compared wheat yields, reported for counties3 in Kansas (1970 through 2007) against monthly SPEI values, after removing linear historic trends attributed to improved genetics and production technologies.
A moderate relationship (R2 = 0.41)4 emerged for wheat yields reported for counties in W Kansas, indicating positive effects of weather conditions in February, March and April. A weaker relationship (R2 = 0.25) resulted for counties in sub-humid E Kansas, indicating both positive (October, February, April) and negative (August, December, May, June) relationships with the SPEI metric. This regression analysis quantified the relationship of winter wheat productivity to weather variation during the growing season. However, the utility of forecasting skill depends on the information available prior to planting decisions.
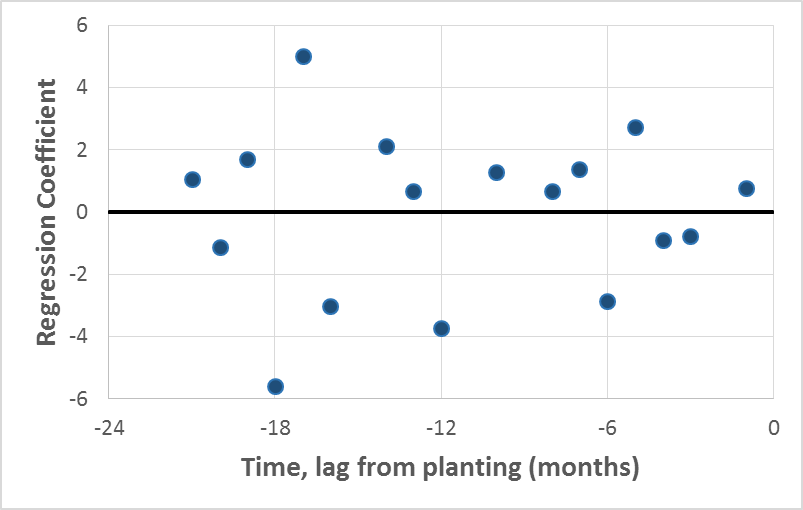
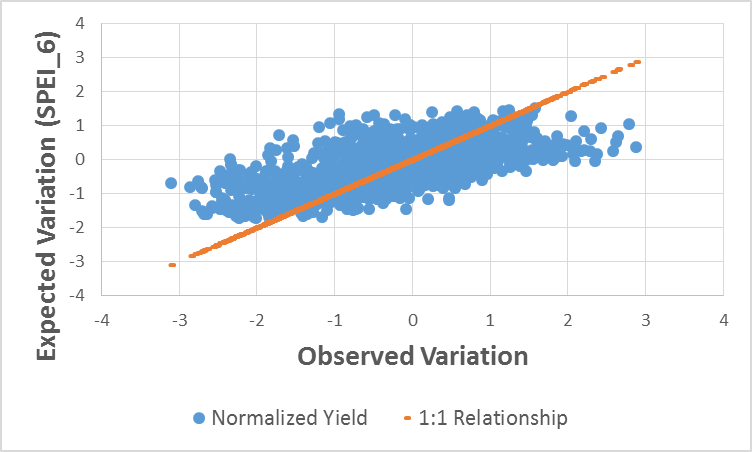
Thus, we evaluated a hypothesized ENSO signal: is winter wheat grain productivity in W Kansas related to equatorial Pacific Ocean surface temperatures in preceding years? We tested the null form of this hypothesis using multiple regression for W Kansas county yield reports and monthly ENSO data for the 24-month period prior to wheat planting (September, a year prior to harvest). We found a positive result. A moderately strong relationship (R2 = 0.53) resulted from regression analysis (Figure 1). Interestingly, the strongest influences were ENSO values 18- and 16-months prior to the wheat planting period (Figure 2). This indicates that complex patterns in equatorial Pacific Ocean temperatures can convey information which is pertinent to subsequent winter wheat yields in W Kansas. There is an opportunity to develop climate-informed decision-support for cropping systems in the U.S. central High Plains.
References
1 Baumhardt, R.L. S.A. Mauget, R.C. Schwartz and O.R. Jones. 2016. El Nino Southern Oscillation effects on dryland crop production in the Texas High Plains. Agron. J. 108:736-744).
2 Aiken, R., X. Lin and Z. Zambreski. 2017. Winter wheat yield responses to climate variation in the U. S. Central Great Plains. ASABE Paper No. 1701661 DOI: https://doi.org/10.13031/aim.201701661
3 National Agricultural Statistics Service
4 ‘R’ squared (R2) indicates the fraction of observed variation which can be accounted for by a regression relationship.
Please note: this is a commercial profile
Prof Robert Aiken
Research crop scientist
Northwest Research—Extension Center
Tel: +1 785 462 6281
https://www.northwest.k-state.edu/


