
An underwater topographic survey for Taiwan offshore wind farms is detailed here by Gwo-shyh Song, Associate Professor at the National Taiwan University
Concerning the development of an offshore wind farm in Taiwan, the first data obtained is from the underwater terrain or the so-called bathymetric measurement. Based on this data, we can map the topographic map under the water. Designers will, therefore, can determine the location of each wind turbine foundation based on this underwater topographic map. According to modern construction technology, the maximum depth of the foundation is only located at 50 metres deep.
It is more difficult is to construct in a place where the depth of water is only 50 metres deep so this increases the cost.
But the measurement of underwater terrain is not just to understand the depth of the wind turbine location, because all power produced by the wind turbine must be transmitted by the power cable to the electricity generated by the transmission line into the grid for distribution. As a result, on the western offshore of Taiwan, in addition to the construction of hundreds of wind turbines placed on the seafloor, there will be electric cable network fitted between the foundations and cable routes extended from the sea to the land.
Many wind farms developed in Taiwan are located offshore. Their position is dozens of kilometres away from land and covers a very large area. Therefore, for the proper laying of these cables, it is necessary to conduct a very accurate bathymetric survey to obtain a high-resolution data set from a wide area.
The equipment used here is called multibeam echo sounder. Unlike single beam sounders, multibeam systems use beamforming to extract directional information from the returning sound waves, producing a swath of depth readings from a single ping.
The full swath across the survey track includes a narrow track and forms over hundreds of multiple receive beams that are so narrower less than 1 degree depending on the system. With this design, with these collected data, it usually can map shipwreck, sand waves and pipeline using 3D visualisation technique.
With these cables laying on the seabed, there are several key points that must be noted:
• The shorter the distance the cable is laid, the more the cost of construction can be reduced;
• To protect the cable from the activities of fisheries, the cable is spread over the sandy seabed and covered with sediments, in addition to the biological reef or rock area;
• Cable do not pass through areas with large terrain slopes, such as steep slopes or soft places, where earthquakes can easily produce a landslide or slump to break the cable, or where in large sand waves territory, the direction of parallel sand waves must be laid so that the cables do not span between the waves and hang on to the seabed;
• In places where the topography of seafloor is prone to topographic changes, the characteristics of terrain changes must be understood for the laying of cables; for example, there are a series of sand waves in Taiwan Strait area, which move forward or in the direction of the bottom current.
In the wind farm areas of the Taiwan Strait, after previous surveys, because there are strong bottom currents in the area, over half of the wind farms have large sand waves (or dunes) shown on the seabed, shaped with more than hundreds of metres long and 10 metres or about three stories high.
Take the Formosa III (F-3) Wind Farms as an example; this wind farm is located in the central western Taiwan offshore or northern area of the Penghu Island. It occupies three areas, each of which is around 100 square kilometres and a development license has been applied for here by Macquarie Investment Management Limited. Hence, it covers an area around 280 square kilometres and its west margin is over 70 kilometres away from the coastline of Taiwan. They are scheduled to install about 170 6M watts wind turbines so that the development of power generation can go to one gigawatt of electricity.
Global Aqua Survey Limited was commissioned by Macquarie to investigate the migration of sand waves in the F3 Wind Farms area. As a result, in 2016 and 2017, the Reson’s SeaBat 8101 multibeam echo-sounder was used to collect the bathymetrical data in the whole region.
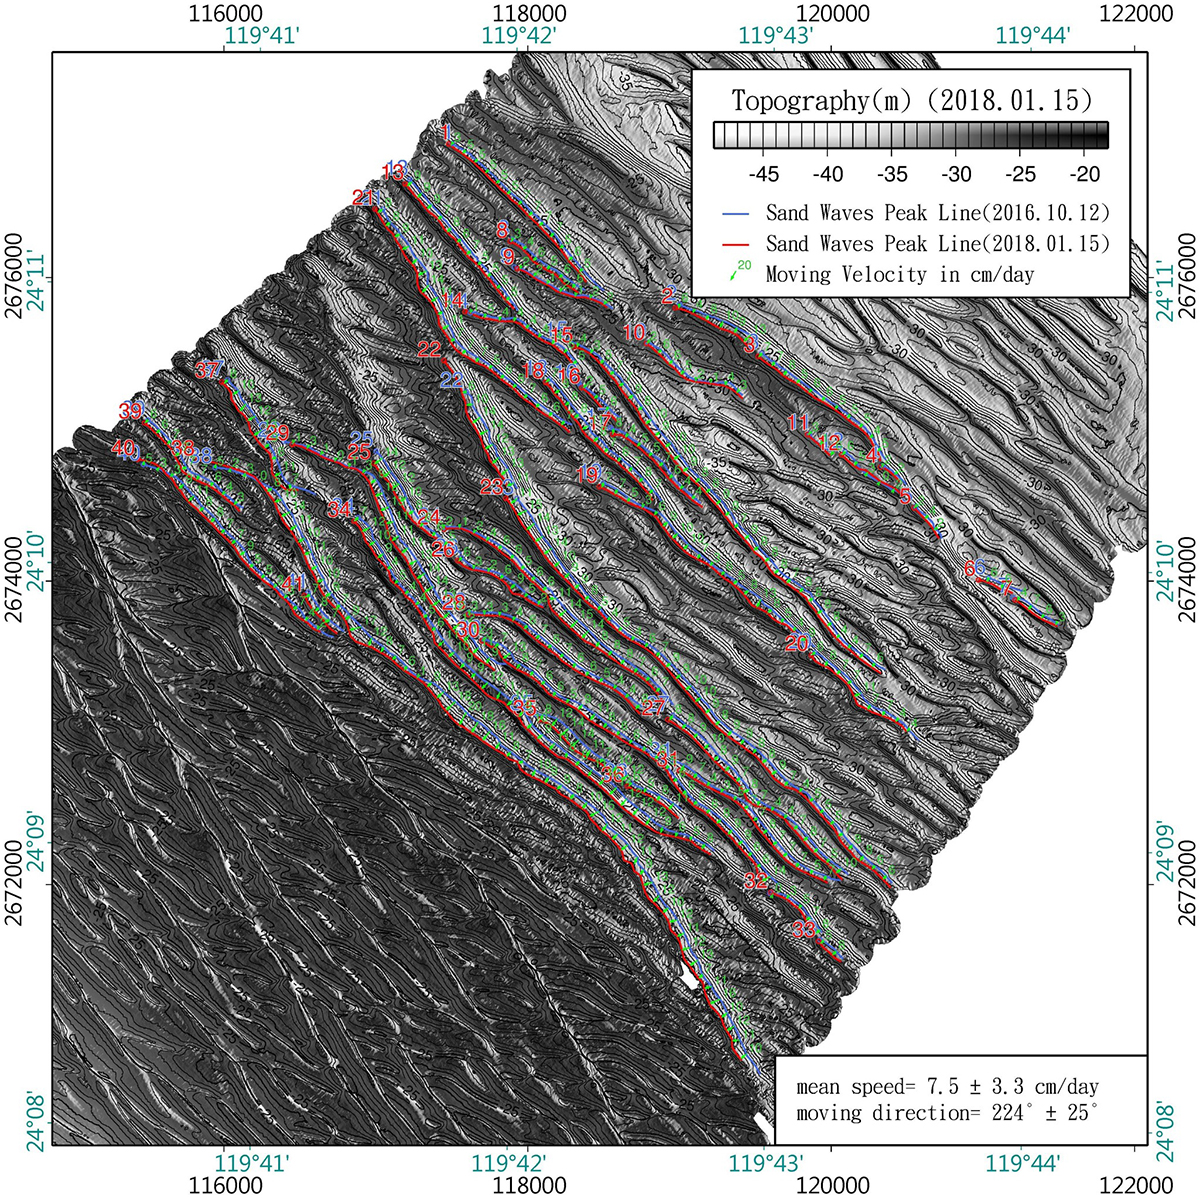
Figure 1 shows the underwater topographic map of the 11th wind farm in F3 area, where the vigorous development of sand waves can be seen in the area with a depth of 20-30 metres. In the area, there are many groups of long bed waves 1 kilometre long and 6-10 metres tall, covered with sand waves 150 metres long and 3.5 metres tall on the surface of these long bed waves.
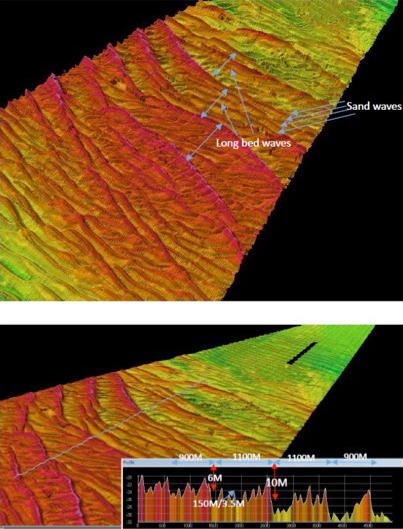
In order to analyse whether these sand waves will move, one kind of presentation resulting from the variance analysis of the two-year data is shown in Figure 2. This picture uses some motion vectors to show how the sand waves moved within the area and indicate that the sand waves moved in southwestern direction at a mean speed of 7.5cm per day or 27.4 metres per year in that period of time.
Gwo-shyh Song
Associate Professor
National Taiwan University
Tel: +886 (0)930 053 046
Gwoshyh007@gmail.com & songs@ntu.edu.tw
www.oc.ntu.edu.tw/oceng/?page_id=24
*Please note: This is a commercial profile


