

The need for public health officials to be able to model the spread of infectious diseases has never been more apparent than in the early days of the SARS-CoV-2 pandemic, but what needs to change?
The questions for which policymakers need answers;
- What is the disease burden?
- Can we reduce cases enough to eliminate infection?
- What is the best timing for interventions?
- Can we permanently prevent infections?
- How cost-effective is a given intervention?
These questions may seem simple because of the many nuanced factors that influence variations in the number of infections caused by a single infected individual or the Effective Reproductive Number.
Mathematical models, specifically dynamic models, can help answer these questions and select the most effective and cost-efficient mitigation strategies.
The usefulness of dynamic modelling in policymaking is readily apparent through a case study drawn from actual practice…
Measuring infectious disease transmission
Epidemiologists use two values to understand and measure disease transmission: the Basic Reproductive Number (Ro) and the Effective Reproductive Number (Rt).
The Ro is the number of new infections caused by a single infected individual in a disease-naïve population. It represents the maximum potential for a disease to spread at a particular time. The Rt is the number of new infectious cases caused by a single individual, but it can be measured at any specific time during an epidemic.
The Rt represents the ability of the disease to spread, given the circumstances. Various factors, such as the generation of immunity or the replenishment of susceptible individuals, can influence the Rt, as shown in Figure 1. Steps that control the Rt can reduce the number of infectious cases and thus control the spread of an infectious disease.
The Rt can be affected by dynamics that do not directly arise from the infection process at an individual level, such as the slowing of infection rates as an epidemic progresses. Another indirect effect is the shift in the mean age of the first infection when an intervention reduces the prevalence of the disease.
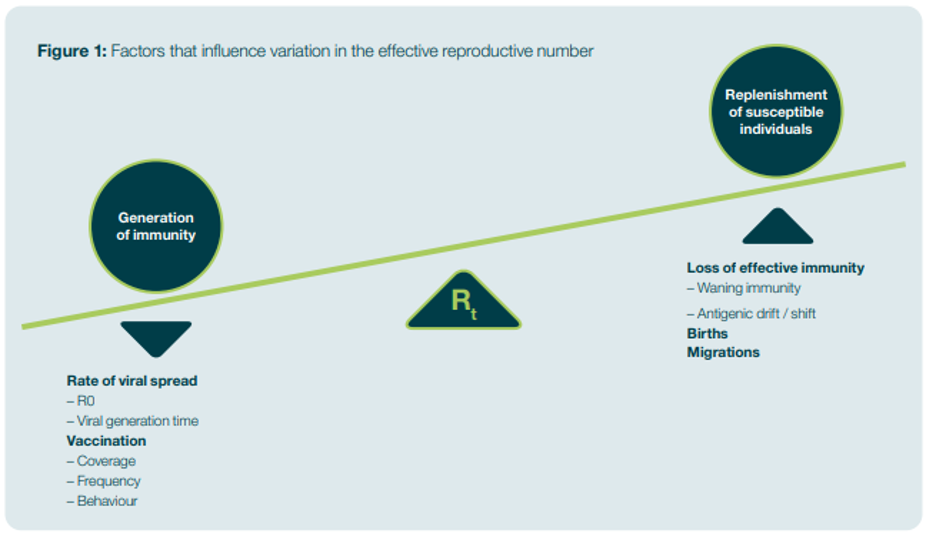
Figure 1: Factors that influence variation in the effective reproductive number
Modelling options in epidemiology
Epidemiologists use models, or mathematical representations of real-world circumstances, to look at various “what if” scenarios and gain insight into complex situations.
Static models that treat the risk of becoming infected as a static, fixed-parameter are acceptable in some limited analyses of disease transmission. They can be used when an intervention does not impact disease transmission (for example, in an age group not involved). They can also generate an initial approximation of an intervention’s impact when analysis suggests that it is cost-effective, and dynamic effects would further enhance this.
Infectious disease transmission, however, is non-linear (meaning that the incidence depends on more than one thing), and the indirect effects of an infectious disease’s dynamics can have many side effects. For instance, reductions in the probability of being infected can lead to changes in the age of the first infection. Static models are only appropriate in some circumstances, and relying on them will contribute to poor decision-making.
On the other hand, dynamic transmission models reflect that the rate at which susceptible individuals become infected depends on the number of infected and susceptible individuals at any time. In other words, the overall number of infected and susceptible individuals influences the likelihood of a susceptible individual becoming infected.
Unlike static models, dynamic models are appropriate for studying all infectious diseases. Indeed, they must be used when:
- An intervention can have a direct impact on the spread of the disease and transmission rates (such as mass vaccination decreasing the proportion of susceptible individuals or non-pharmaceutical interventions changing contact rates)
- Decision-makers are interested in eliminating transmission locally or in eradicating the disease (global elimination)
Dynamic models offer several advantages over other models:
- They provide a framework to capture mechanisms and indirect effects on the Rt (such as herd immunity).
- Their design allows them to capture the fundamental details of disease transmission dynamics, particularly non-linearity. Therefore, they can capture all consequences of the measures applied.
- They can appropriately account for uncertainty in parameter values, which is particularly important when there are non-linear system feedback effects since small changes in parameter values can result in disproportionately large changes in the transmission dynamics of a disease.
- They can be used to identify critical drivers of outcomes with greater accuracy than a static model.
Because dynamic models account for non-linear dynamics and thus capture changes in the risk of infection, they have great utility, including:
- Predicting changes in the mean age of first infection and any resulting impact on morbidity and mortality
- Modelling the competitive advantage between pathogen strains
- Providing insight into strain replacement following vaccination or antimicrobial resistance
- Estimating the burden of disease
- Evaluating different mitigation strategies
- Evaluating the cost-effectiveness and budget impact of vaccination programs
- Identifying critical drivers of an intervention’s value
- Analyzing vaccine policies more broadly
A real-life application
ICON was engaged to determine the cost-effectiveness of an investigational influenza vaccine for children in the UK compared to other vaccines. The current policy was to vaccinate only the elderly and at-risk groups. What would be the impact of broadening the policy to include children?
The Methodology
To address this question, ICON created an economic model with a dynamic transmission component that captured pediatric vaccination’s direct and indirect effects. The model was a deterministic, compartmental transmission model in which the population was subdivided into individuals who were susceptible to infection (those who had no immunity), those who were exposed (and infected) but had not yet become infectious, those who were infectious (symptomatic and asymptomatic), those who had recovered, and those who were vaccinated and immune.
We used data on the temporal dynamics of influenza by age in different healthcare settings derived from UK databases, including hospitalization statistics, mortality data, laboratory-confirmed infections, and a database of influenza-like illnesses. We had to tease out instances of influenza from other illnesses to use the latter. We could then attach costs to those outcomes, arriving at a cost-based health measure.
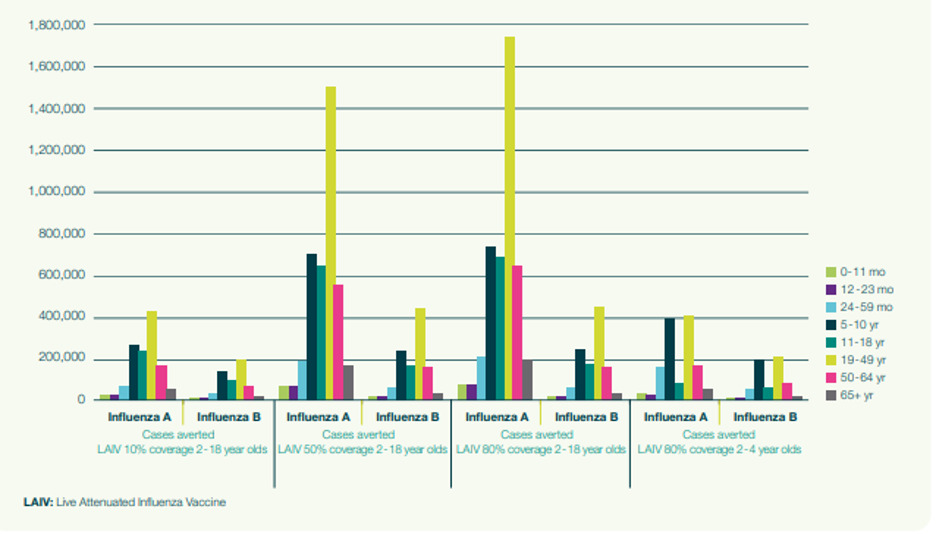
We calibrated the model against the data to examine different vaccination scenarios. Specifically, we looked at 10 per cent, 50 per cent, and 80 per cent vaccination rates among 2 to 18-year-olds with both the investigational vaccine and the comparator, as well as 80 per cent vaccination rates among 2 to 4-year-olds. Each of these scenarios were tested against the background of the current vaccination policy.
We considered various key parameters, including how individuals of different age groups interact within a community, a transmission coefficient, and clinical details of an infection (such as latency duration, infectiousness, and immunity). This was summarised in a basic reproductive rate of 1.8. As this was a cost analysis, we built a discount rate for costs and benefits (3.5 per cent per year) and a time horizon of 15 years.
Results
Figure 2 displays the impact of vaccination expressed through the number of averted infectious cases of influenza of two types (A and B), stratified by age group. As vaccination coverage increases, a significant number of cases of influenza are averted in age groups that are not targeted for vaccination. This demonstrates the importance of capturing the impact of preventing secondary cases using a dynamic model. A static model would not have captured this.
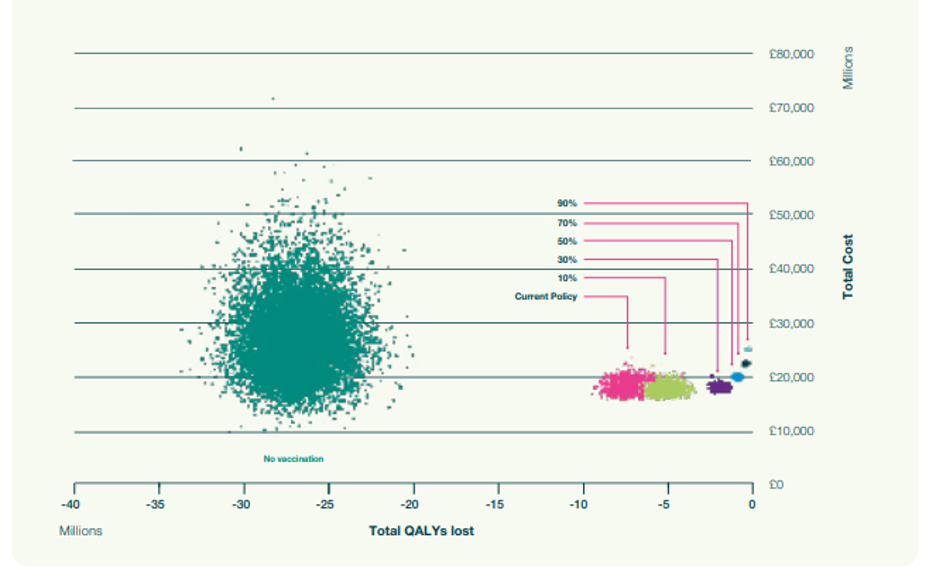
We then calculated the number of quality-adjusted life years (QALYs) lost and their associated cost. Figure 3 shows the output of the simulations for no vaccination (green cloud), the current policy of vaccinating only older people and at-risk (pink cloud), and various levels of increasing vaccination coverage within 2-18-year-olds. (The clouds result from the uncertainty in the expected costs of QALYs associated with each scenario.)
As vaccination rates go up, fewer QALYs are lost, which is to be expected. However, there is a degree of diminishing return in that after a while, costs escalate quickly while the clouds become smaller. In other words, once coverage levels become very high, transmission is reduced, and consequently, the added benefit of further increasing vaccination levels diminishes.
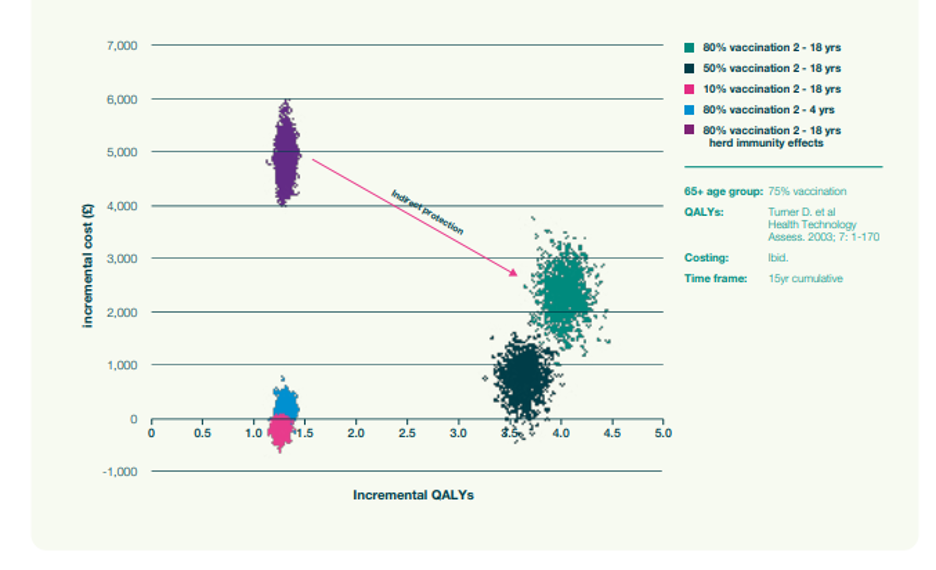
We then used our dynamic model to project the indirect effects of QALYs and cost over a 15-year time frame on individuals (2- to 18-year-olds) who were not vaccinated. We compared those results to the current policy of vaccinating people over 65 and at-risk groups. In Figure 4, the purple cloud (higher cost and fewer QALYs saved) is the impact predicted by a static model that fails to account for indirect protection. The pink cloud is the corresponding cloud generated by a dynamic model that accounts for indirect protection. This clearly shows the impact of indirect protection in the analysis – the enhancement of the QALYs that are prevented from being lost and the cost reductions.
We also considered all variations – the spread of these cost estimates per QALY in each scenario – and looked at the probability of each scenario being cost-effective at a particular cost-effectiveness threshold.
By distilling all that uncertainty and the estimates of outcome and cost, we could determine which scenario would have the highest probability of being cost-effective for any cost-effectiveness threshold. This indicated what is likely to be the best, most cost-effective policy.
In Figure 5, the cost-effectiveness acceptability curve illustrates the probability of each scenario being cost-effective at various cost-effectiveness thresholds (these thresholds being how much we’re prepared to pay for a QALY).
In the UK, an intervention is deemed cost-effective at a cost per QALY of £20,000 – £30,000, so the graph indicates the probability of each scenario being cost-effective at thresholds between £20K – £30K.
The cost-effectiveness acceptability frontier in Figure 6 illustrates the probability of the scenario with the highest net health benefit being cost-effective at each threshold value. For thresholds between £20K – £30K, the graph indicates which scenario gives the greatest net health benefit and the probability of it being cost-effective.
This methodology allowed us to account for indirect effects and their significant impact on the estimated cost-effectiveness of a vaccine in a way that static modelling could not. Dynamic transmission modelling allowed us to accurately estimate and compare the value of multiple vaccine strategies while accounting for the impact of parameter and structural uncertainty.
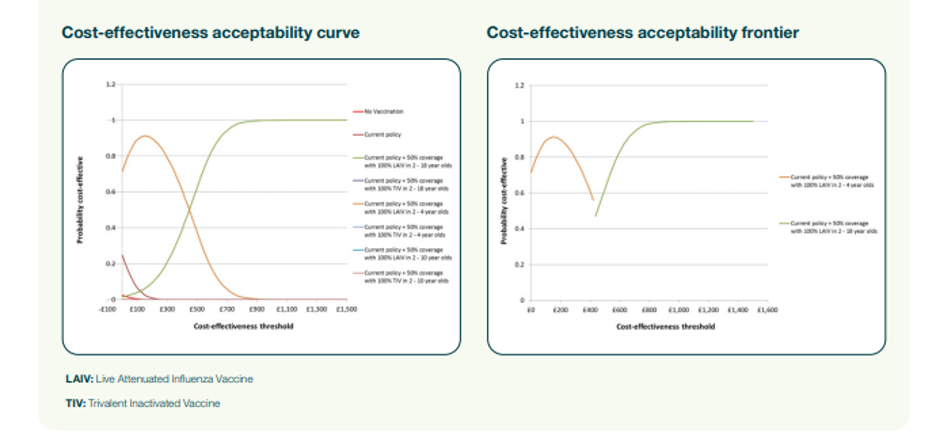
Figure 5 demonstrates that dynamic modelling effectively estimates introducing a new vaccine’s direct and indirect impact. Combined with a probabilistic sensitivity analysis, the resulting analyses provide useful information to decision-makers choosing between alternative strategies in an uncertain world.
Conclusion
Dynamic modelling is a powerful tool that provides quantitative insights for answering complex questions surrounding disease transmission and the value of interventions. It is suited to more situations than static modelling as it incorporates indirect effects at the population level to reflect changes in the risk of infection. More nuanced details can be used to estimate the disease burden, evaluate different mitigation strategies, evaluate the cost-effectiveness and budget impact of vaccination programs, identify critical drivers of an intervention’s value, and analyze vaccine policies more broadly.
This piece was written and provided by Richard Pitman, PhD, Lead Health Economist & Epidemiologist, ICON.
Richard has over 30 years of experience in the epidemiology, burden of illness and mathematical modelling of infectious diseases, particularly relating to the cost-effectiveness of interventions and policy issues. Disease areas include influenza, SARS, rotavirus, respiratory syncytial virus, tuberculosis, directly transmitted childhood infections, vector-borne diseases and HIV.